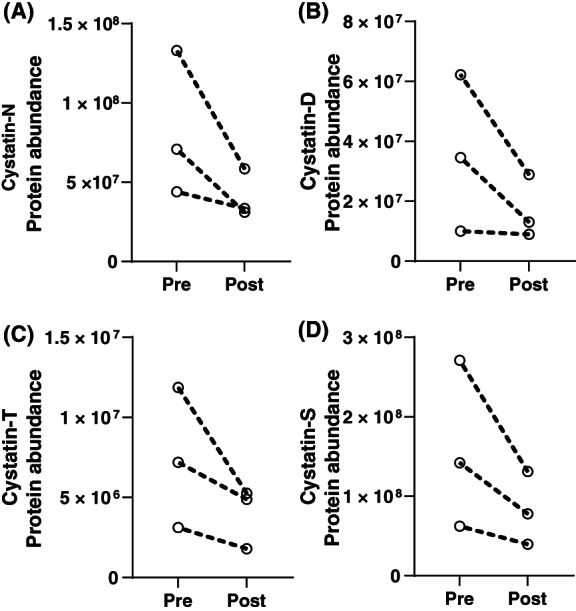
FIGURE 3.

Human cystatin proteins with differential abundance. Protein abundances were plotted for the three subjects, with intraindividual pre‐ and post‐octreotide values separated by a dotted line. Cystatin proteins which were significantly lower after octreotide treatment included (A) cystatin‐SN (CYTN_HUMAN), (B) cystatin‐D (CYTD_HUMAN), (C) cystatin‐SA (CYTT_HUMAN), and (D) cystatin‐S (CYTS_HUMAN). Data were plotted in GraphPad Prism
