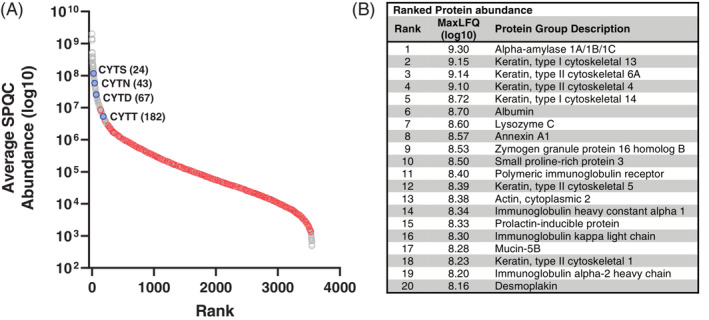
FIGURE 4.

Ranked protein abundance in saliva. (A) Average protein abundances in SPQC runs (log10 MaxLFQ values) were plotted for all quantified proteins. Gray, human proteins; red, Streptococcus mitis proteins; blue, cystatin proteins that were significantly lower after octreotide treatment. (B) Top 20 proteins based on rank abundance (excluding porcine trypsin; Table S4)
