FIGURE 2.

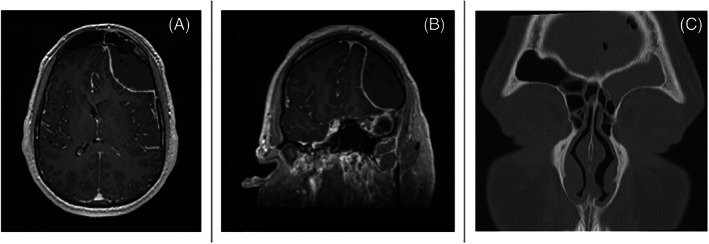
Axial (A) and coronal (B) T2 weighted magnetic resonance imaging (MRI) showing left frontal epidural hematoma. (C) Coronal computed tomography (CT) showing left frontal sinus opacification

Axial (A) and coronal (B) T2 weighted magnetic resonance imaging (MRI) showing left frontal epidural hematoma. (C) Coronal computed tomography (CT) showing left frontal sinus opacification