
Figure 3:
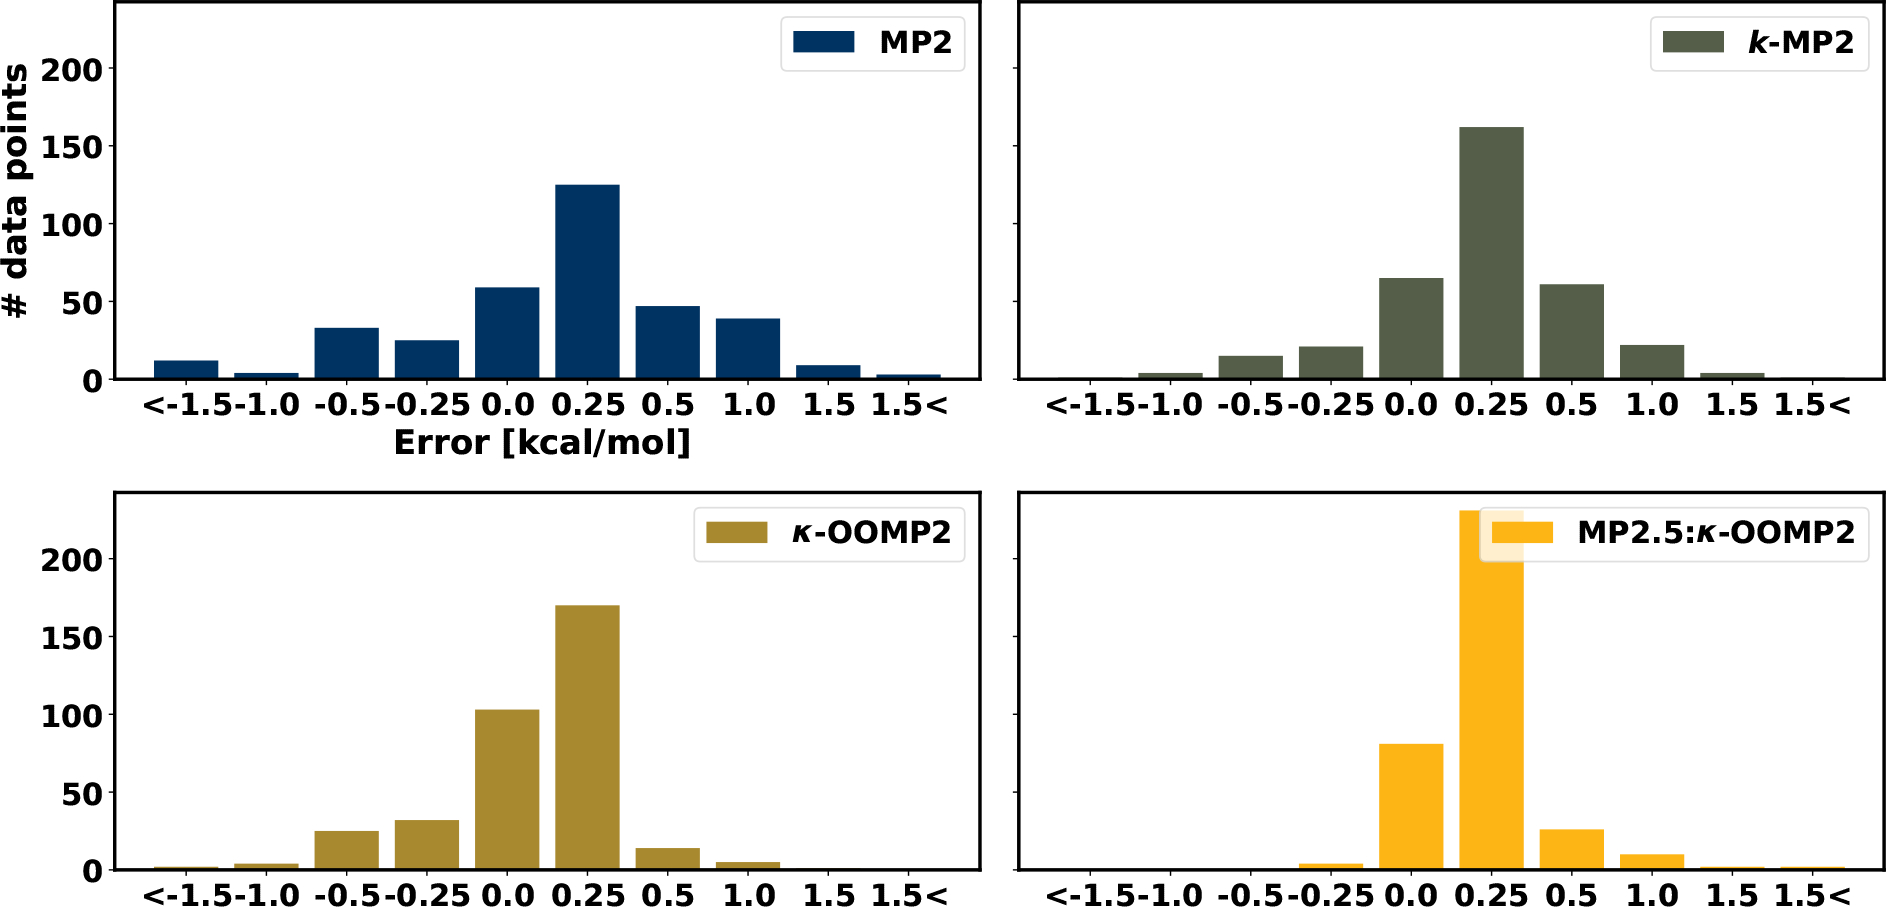
Histogram of the absolute deviation of MP2 (top left panel), κ-MP2 (top right panel), κ-OOMP2 (bottom left panel) and MP2.5:κ-OOMP2 (bottom right panel).
Official websites use .gov
A
.gov website belongs to an official
government organization in the United States.
Secure .gov websites use HTTPS
A lock (
) or https:// means you've safely
connected to the .gov website. Share sensitive
information only on official, secure websites.
Histogram of the absolute deviation of MP2 (top left panel), κ-MP2 (top right panel), κ-OOMP2 (bottom left panel) and MP2.5:κ-OOMP2 (bottom right panel).