
Figure 4:
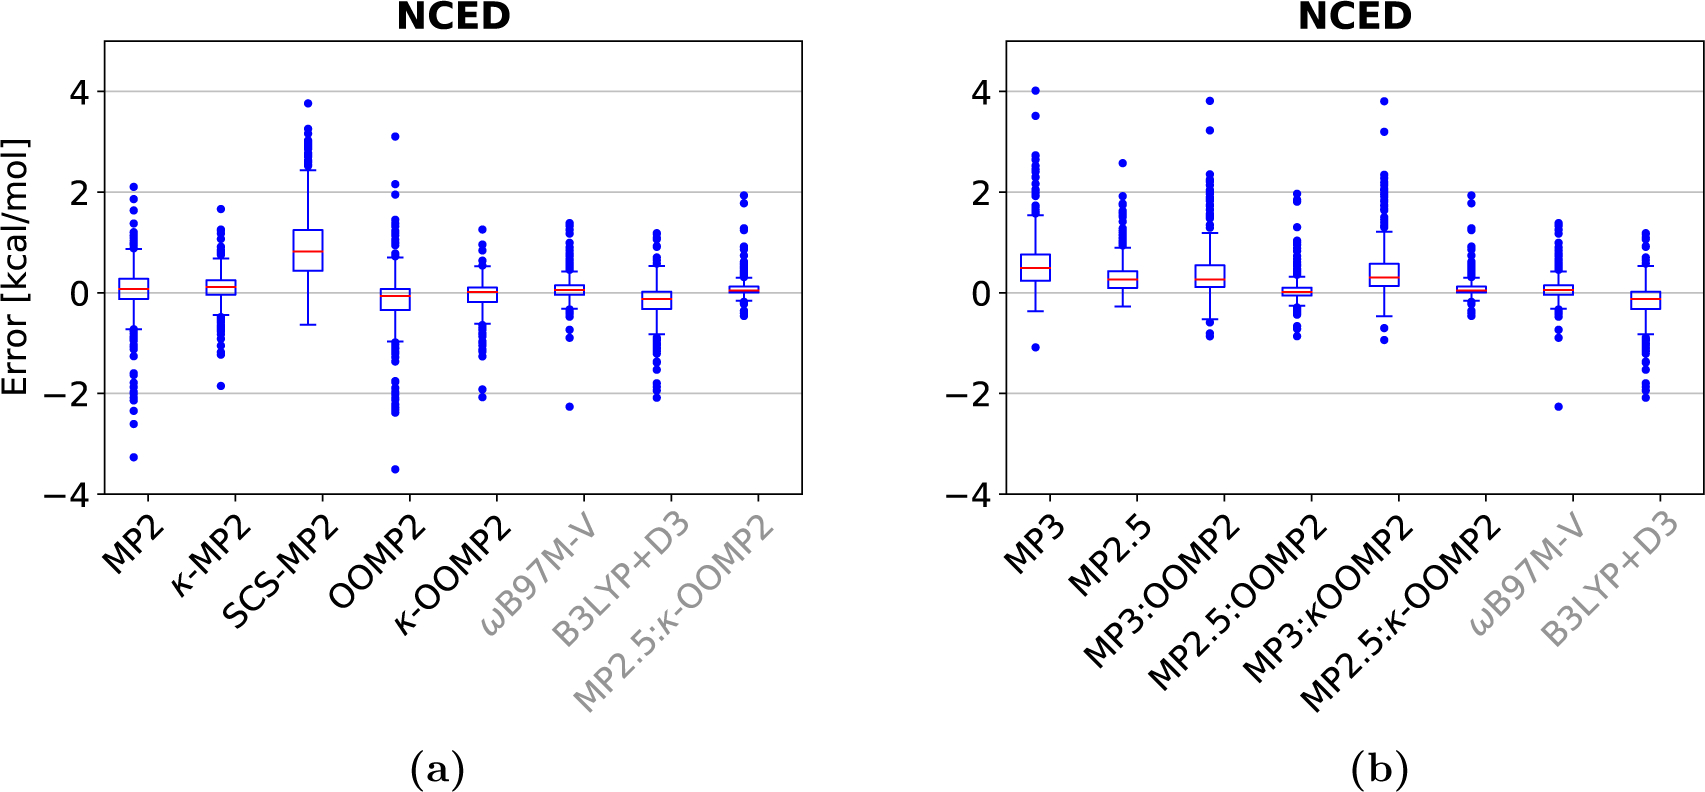
Boxplots of the NCED data category for (a) MP2 methods, (b) MP3 and DFT methods. Red lines mark the median deviation, boxes bound the central 50% of the data, whiskers enclose all data points within 1.5 times the inter-quartile range of the box edges, and points denote outlying data. DFT and MP2.5:κ-OOMP2 are included in all plots for comparison.