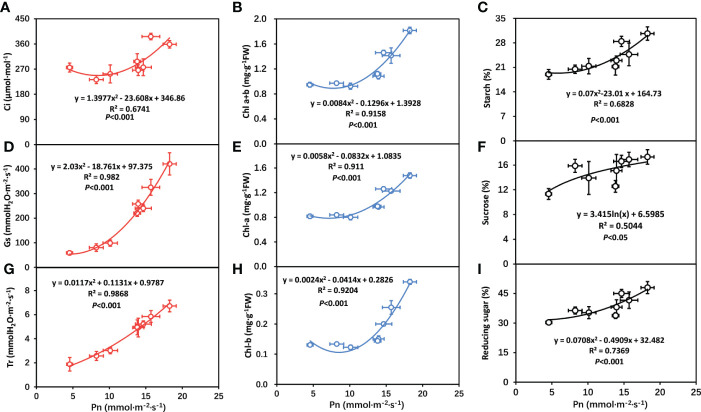
Figure 7.
Correlation analysis of photosynthetic rate with gas exchange parameters in tobacco plants. (A) correlation between intercellular carbon dioxide concentration (Ci) and net photosynthetic rate (Pn); (B) correlation between total chlorophyll contents (Chl-a+b) and net photosynthetic rate (Pn); (C) correlation between starch and net photosynthetic rate (Pn); (D) correlation between stomatal conductance (Gs) and net photosynthetic rate (Pn); (E) correlation between chlorophyll-a contents (Chl-a) and net photosynthetic rate (Pn); (F) correlation between sucrose and net photosynthetic rate (Pn); (G) correlation between transpiration rate (Tr) and net photosynthetic rate (Pn); (H) correlation between chlorophyll-b contents (Chl-b) and net photosynthetic rate (Pn); (I) correlation between reducing sugar and net photosynthetic rate (Pn). The statistically significant mean differences among various treatments were identified by using Duncan’s test at a significance level of P<0.05.

