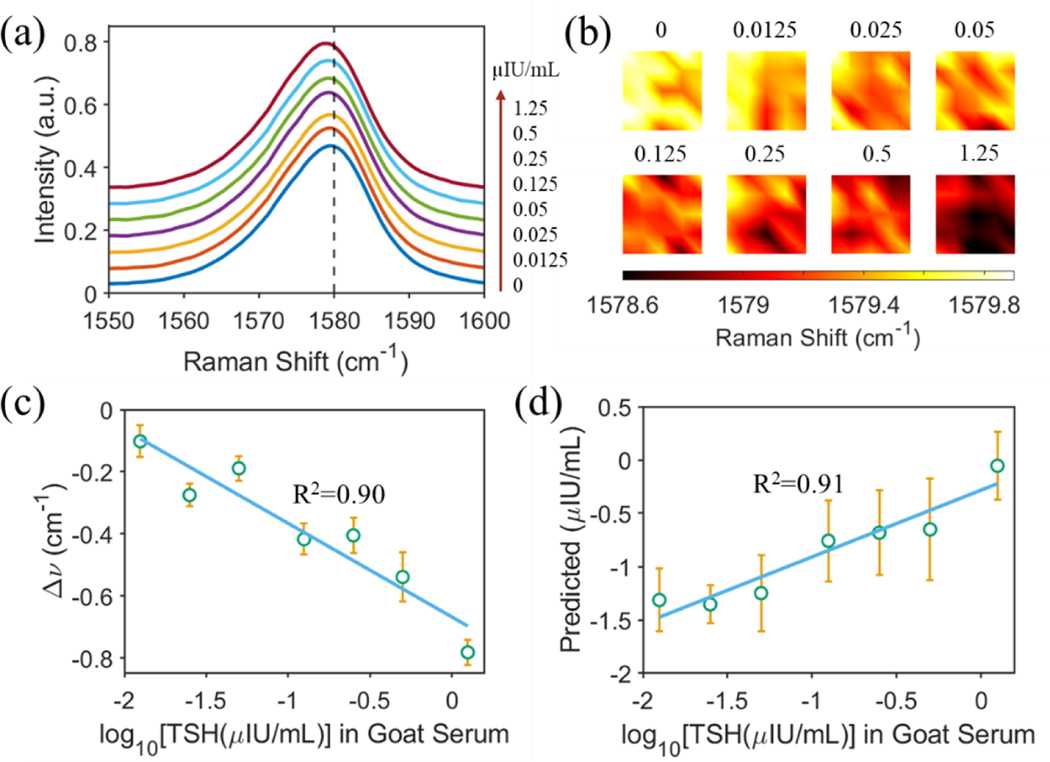
Figure 4. Detection of TSH in diluted goat serum.
(a) Measured SERS spectra using the PRISM assay with an increase of TSH concentration as specified in the figure. Each spectrum was averaged from 5 × 5 spectra collected over a 20 μm × 20 μm area using Raman mapping with a 785 nm excitation laser wavelength. (b) Mapping of the SERS peak wavenumber at 1580 cm−1 with various TSH concentrations as specified. (c) Regression analysis based on the shift of the SERS peak about 1580 cm−1. (d) Correlation between the predicted and the true TSH concentrations in log10 scale. The goat serum matrix was diluted using the TSH calibrator matrix with a ratio of 1:3.

