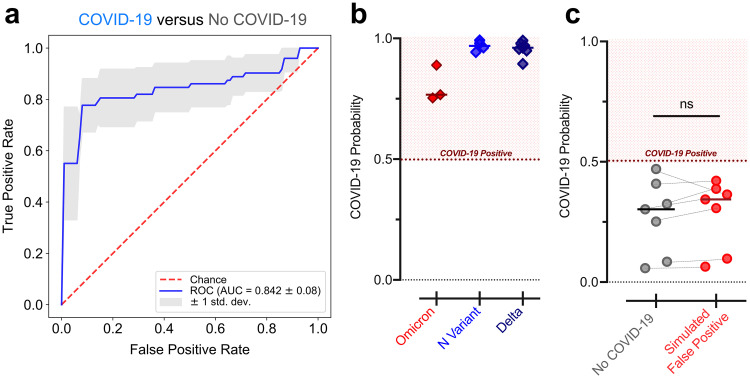
FIG 2.
Performance of 2-gene SVM COVID-19 diagnostic classifiers in qPCR assays. (a) ROC curve demonstrating performance of the IFI6+GBP5 SVM classifier for distinguishing samples from patients with and without COVID-19 using the qPCR data, estimated by 5-fold cross-validation. Mean and standard deviation of the AUC across the five folds is reported. (b) Average probability of COVID-19 derived from the IFI6+GBP5 qPCR cross-validation classifiers for samples with the Omicron variant (n = 3), the N-gene variant (n = 4), and the Delta variant (n = 7). (c) Average probability of COVID-19 derived from the IFI6+GBP5 qPCR cross-validation classifiers for n = 7 samples without COVID-19 before and after introduction of trace contamination from a sample with high SARS-CoV-2 viral load. Statistical significance was assessed using a one-sided (greater than) paired Mann-Whitney test. ns, not significant.

