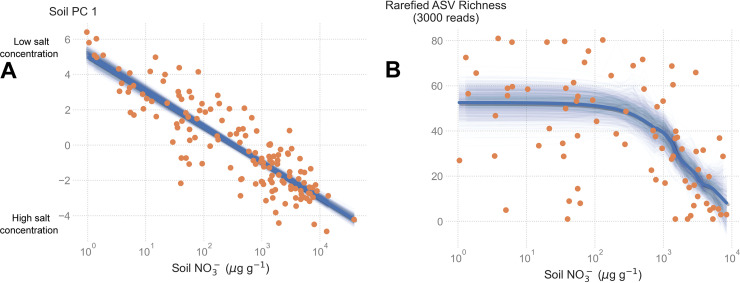
FIG 2.
Relationships between soil salt concentrations, exposure age, and microbial ASV richness. (A) The relationship between soil principal component (PC 1) and soil NO3- concentrations. The thick blue line shows the linear model fit to the observed data, and thin blue lines show 1,000 bootstrapped linear regressions. (B) Relationship between ASV richness and soil NO3- concentrations. Thick blue line shows the LOWESS fit to the observed data, while thin blue lines show 1,000 bootstrapped LOWESS estimates.

