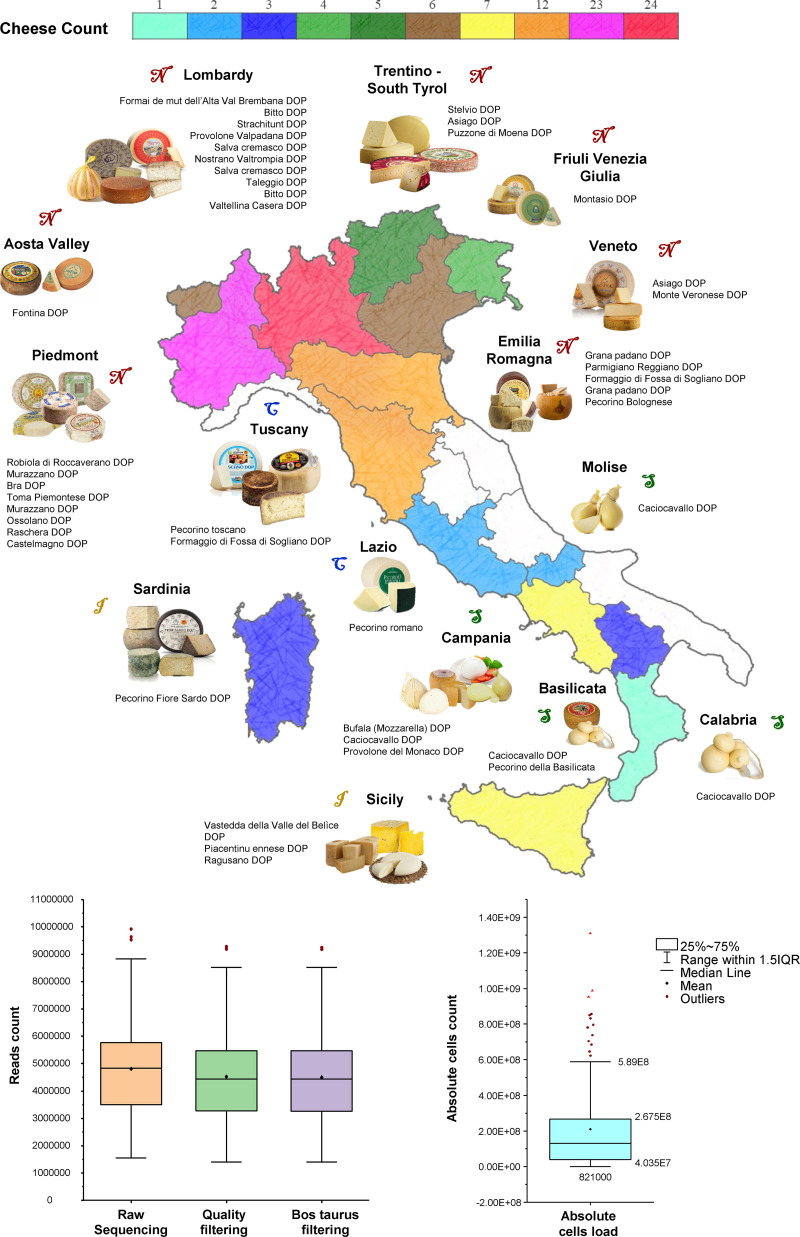
FIG 1.
Geographical distribution of collected cheeses. (a) Schematic representation of Italy, with regions colored according to the number of cheeses collected. For white regions, samples of cheeses have not been collected. Pictures of main cheeses from each region are reported. (b) Whisker plot representing the sequencing depth from raw to filtered reads, while (c) is a Whisker plot representing the absolute cells count distribution of each cheese.

