Figure 1.
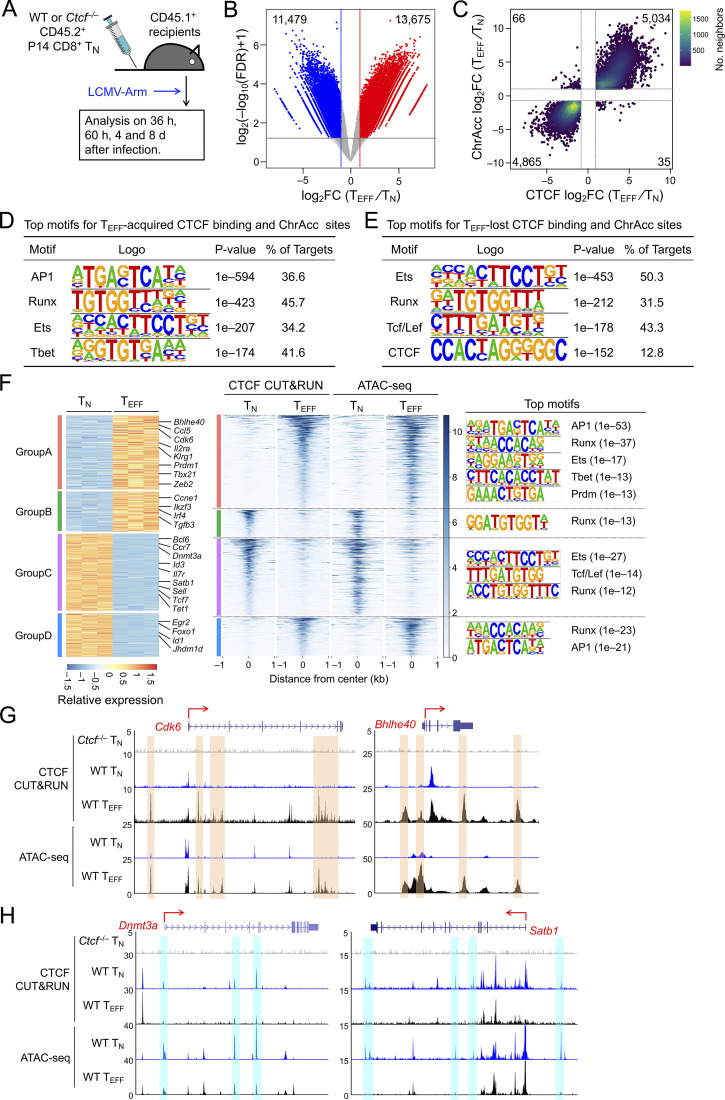
CTCF is redistributed and concordantly affects ChrAcc during TEFF cell differentiation. (A) Experimental design. Donor P14 cells were isolated from LNs, and the donor-derived effector cells were analyzed in the spleen of recipients throughout this study. (B) Volcano plot showing differential CTCF binding strength and statistical significance between WT TEFF and TN cells, with values denoting the numbers of differential CTCF binding sites. (C) Scatter plot showing distribution between differential CTCF binding strength and differential ChrAcc sites in comparisons between WT TEFF and TN cells, with values denoting site numbers. (D and E) Top motifs in TEFF-acquired and TEFF-lost CTCF + ChrAcc sites (quadrants i and iii in C, respectively) based on HOMER analysis. (F) Heatmaps showing DEGs and their associated differential CTCF binding and ChrAcc sites. DEGs linked to key GO terms (Fig. S2 E) were allocated into different groups based on the pattern of CTCF binding and ChrAcc changes, where select genes are marked and the color scale denotes relative strength of each molecular feature. Top motifs for CTCF + ChrAcc sites in each group are listed. (G and H) Tracks of CTCF CUT&RUN and ATAC-seq in WT TN and TEFF cells at select genes in groups A (G) or C (H), which are associated with concordantly acquired CTCF + ChrAcc sites (denoted with orange bars in G) or with concordantly lost CTCF + ChrAcc sites (denoted with blue bars in H). Tracks in gray denote CTCF CUT&RUN in Ctcf−/− TN cells as a negative control.

