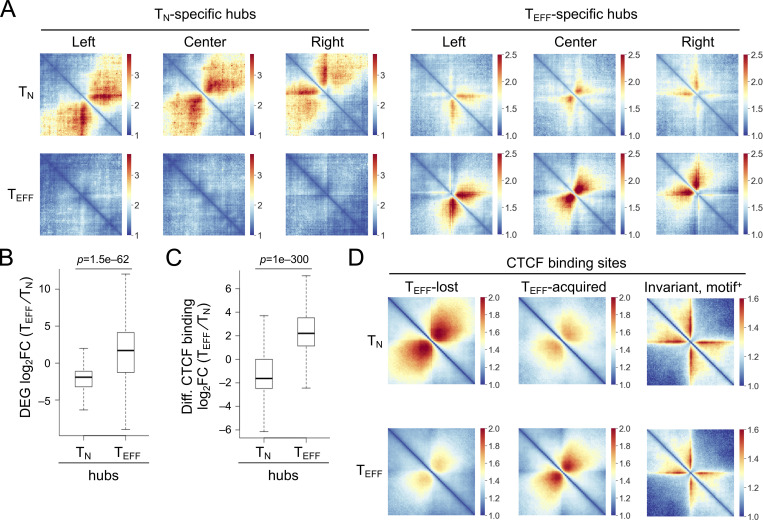
Figure 2.
TN and TEFF cells form distinct chromatin interaction hubs. (A) Heatmaps showing chromatin interactions in TN- and TEFF-specific hubs through Hi-C pile-up analysis centered on hub center and edges in both cell types. (B) Box plots summarizing expression changes of DEGs in TN- and TEFF-specific hubs. (C) Box plots summarizing binding strength changes of differential CTCF binding sites in TN- and TEFF-specific hubs. The box center lines denote the median, box edge denotes interquartile range (IQR), and whiskers denote the most extreme data points that are no more than 1.5 × IQR from the edge. P values were determined with one-sided Mann–Whitney U test. (D) Heatmaps showing ChrInt among +/−500 kb regions centered on the TEFF-lost, TEFF-acquired, and motif+ invariant (fold change ≤1.1) CTCF binding sites, based on pile-up analysis of Hi-C data in TN and TEFF cells, where color scale denotes ChrInt strength.

