Figure 3.
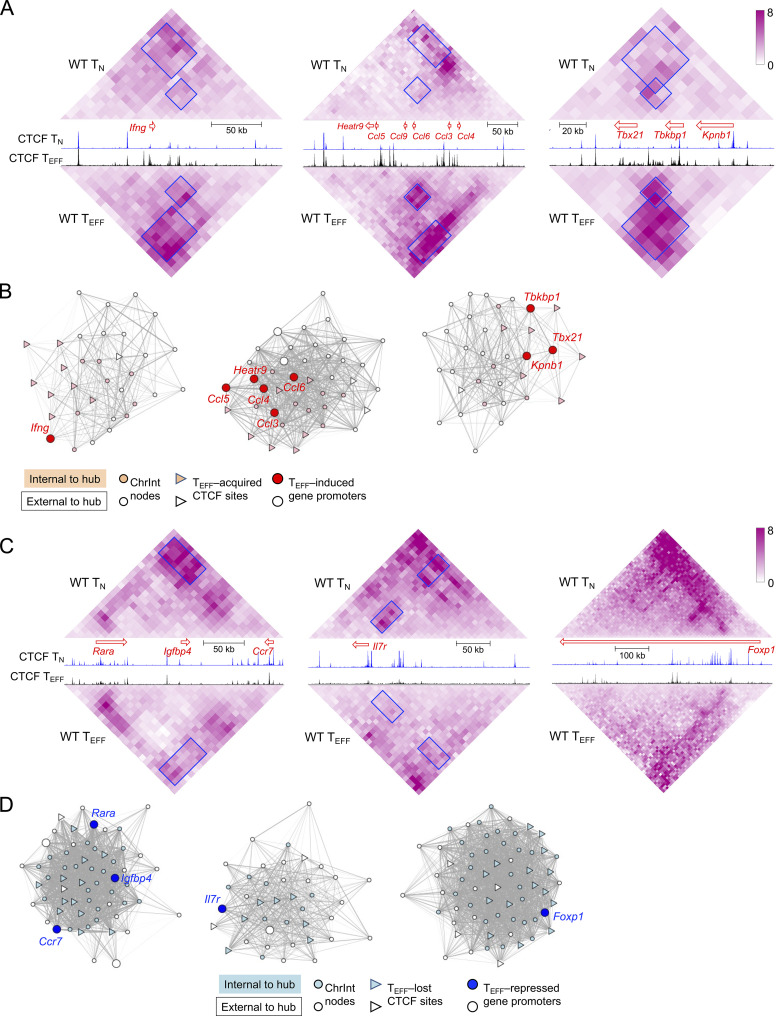
CTCF redistribution is associated with genomic architectural changes in TEFF cells. (A and C) Diamond graphs showing ChrInt in TN (top) and TEFF cells (bottom) surrounding cytotoxic effector genes (Ifng, Ccl, and Tbx21 in A) or memory precursor–associated genes (Ccr7, Il7r, and Foxp1 in C) gene loci, as displayed on WashU epigenome browser. Blue boxes denoting ChrInt “patches” showing marked changes between TN and TEFF cells. Shown in the middle are gene size and transcription orientation along with CTCF CUT&RUN tracks in TN and TEFF cells. (B and D) Network view of TEFF-specific hubs harboring Ifng, Ccl, and Tbx21 genes (B) and TN-specific hubs harboring Ccr7, Il7r, and Foxp1 genes (D). Filled nodes represent 10 kb bins belonging to the network community underlying the hub, while open nodes belong to +/−100 kb extended genomic regions from the hub. Gray lines denote increased (B) or decreased (D) ChrInt in TEFF compared to TN cells, with line width representing log2 fold change of ChrInt between TEFF and TN cells.

