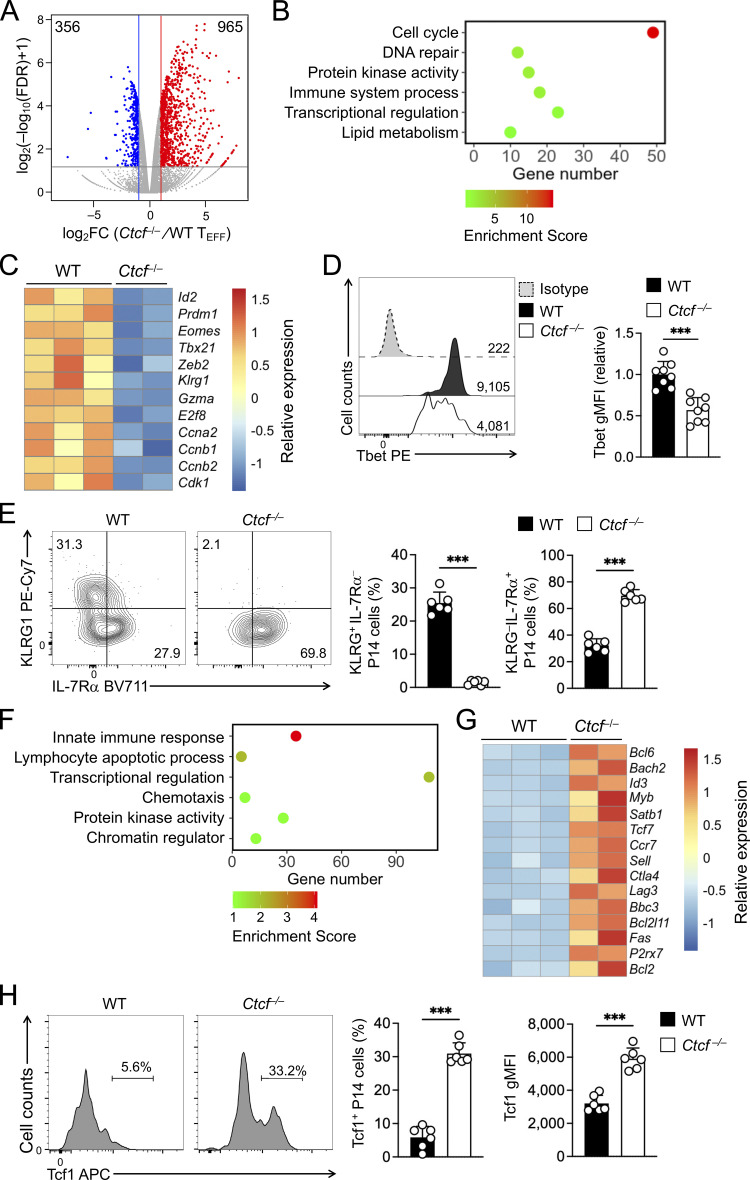
Figure 5.
Ablating CTCF impairs TEFF program but favors TMP program. (A) Volcano plot showing DEGs between WT and Ctcf−/− early TEFF cells isolated on 4 dpi, with values denoting gene numbers. (B and F) GO terms for genes downregulated (B) or upregulated (F) in Ctcf−/− compared to WT early TEFF cells, as determined with the DAVID Bioinformatics Resources, with dot color denoting enrichment scores. (C and G) Heatmaps of select downregulated (C) or upregulated genes (G) in Ctcf−/− compared to WT early TEFF cells. (D and H) Detection of Tbet (D) and Tcf1 (H) proteins by intranuclear staining in WT and Ctcf−/− early TEFF cells isolated on 4 dpi. Values in half-stacked histographs (D) denote gMFI, and those in separate histographs (H) denote percentage of Tcf1+ subset. (E) Detection of KLRG1 and IL-7Rα proteins by surface staining in WT and Ctcf−/− early TEFF cells isolated on 4 dpi, with values denoting percentages of KLRG1hiIL-7Rα− and KLRG1loIL-7Rα+ subsets. Data in D, E, and H are from two independent experiments, and cumulative data are means ± SD. ***, P < 0.001 by two-tailed Student’s t test. gMFI, geometric mean fluorescence intensity.

