Figure 6.
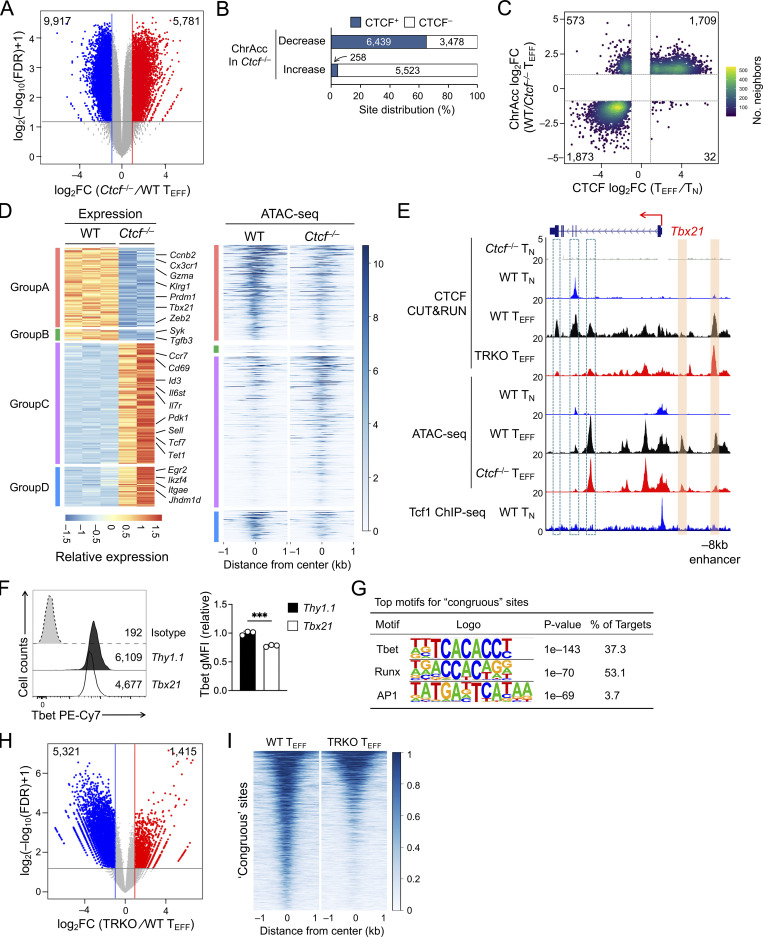
TEFF-acquired CTCF binding activates effector transcriptional program. (A) Volcano plot showing differential ChrAcc sites between WT and Ctcf−/− early TEFF cells isolated on 4 dpi, with values denoting site numbers. (B) Distribution of CTCF binding sites in WT TEFF cells (both dynamic and constitutive) in differential ChrAcc sites between Ctcf−/− and WT early TEFF cells. (C) Scatterplot showing distribution between dynamic CTCF binding sites (in WT TEFF vs. TN comparison) and differential ChrAcc sites (in WT vs. Ctcf−/− TEFF comparison), where the 1,709 sites in quadrant i and the 1,873 sites in quadrant iii are defined as congruous and incongruous sites, respectively. (D) Heatmaps showing DEGs (in WT vs. Ctcf−/− early TEFF comparison) and associated differential ChrAcc sites (overlapping with congruous or incongruous CTCF binding) between WT and Ctcf−/− TEFF cells. The DEGs were grouped based on gene expression patterns defined in WT TEFF vs. TN comparison in Fig. 1 F, with select genes marked. (E) Tracks of CTCF CUT&RUN, ATAC-seq, and Tcf1 ChIP-seq at the Tbx21 gene locus. Orange bars denote TEFF-acquired CTCF binding sites linked to CTCF-dependent ChrAcc in TEFF cells, and open bars with dotted line denote CTCF binding sites that depended on Tbet and Runx3 (TRKO, Tbx21−/−Runx3−/−). (F) Tbet expression in TEFF cells in which sgRNAs targeting Tbx21 −8 kb enhancer (marked in E, Chr.11) or Thy1 constitutive CTCF binding site (Chr.9) were retrovirally delivered together with dCas9-KRAB-MeCP2. Values in half-stacked histographs (left) denote gMFI, and cumulative data are means ± SD (right) from two independent experiments. ***, P < 0.001 by two-tailed Student’s t test. gMFI, geometric mean fluorescence intensity. (G) Top motifs in the congruous CTCF sites (defined in quadrant i in C), with the incongruous sites as background based on HOMER analysis. (H) Volcano plot showing differential CTCF binding sites between WT and Tbx21−/−Runx3−/− (TRKO) early TEFF cells isolated on 4 dpi, with values denoting site numbers. (I) Heatmap showing CTCF binding strength at the congruous CTCF sites in WT and Tbx21−/−Runx3−/− (TRKO) early TEFF cells.

