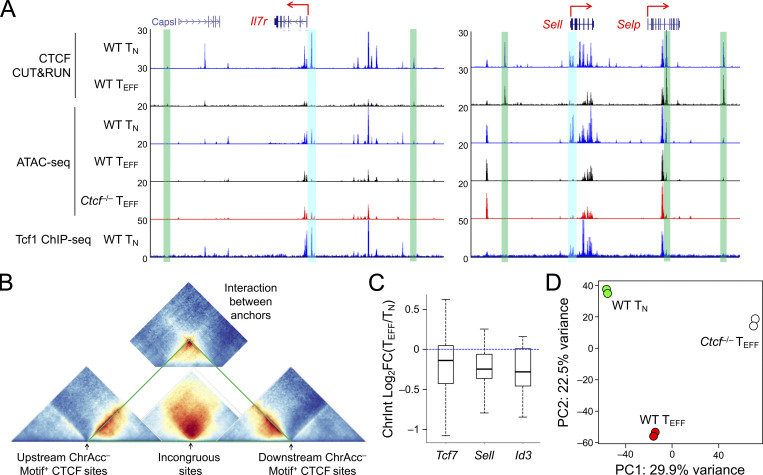
Figure S5.
TMP genes are harbored in insulated neighborhoods demarcated by constitutive CTCF binding and gain access to Tcf1 in CTCF-deficient TEFF cells. (A) Tracks of CTCF CUT&RUN, ATAC-seq, and Tcf1 ChIP-seq at the Il7r and Sell gene loci linked to the incongruous sites (denoted with blue bars). The green bars denote ChrAcc− constitutive CTCF binding sites that are positioned at the boundaries of insulated neighborhoods. (B) Diagram illustrating the relative positions of Hi-C–based ChrInt pile-up profile centering at sites of interest. The incongruous site-centered heatmap (from Fig. 8 A, without mirroring image) is in the middle, and flanked by the boundary anchor–centered heatmaps (from Fig. 8 B, without mirroring image) on each side. Summation of interactions between the boundary anchors (from Fig. 8 C) is positioned on the top, as insulating knots. (C) ChrInt changes between TEFF and TN cells in the insulated neighborhoods harboring Tcf7, Sell, and Id3 genes. The insulated neighborhoods are marked in triangles in solid green lines in Fig. 8 E, and changes in each ChrInt pair within the neighborhoods between TEFF and TN cells are summarized in boxplots, where center lines denote the median, box edge denotes IQR, and whiskers denote the most extreme data points that are no more than 1.5 × IQR from the edge. (D) PCA of Tcf1 binding profile in WT TN, WT and Ctcf−/− TEFF cells, where library size-normalized Tcf1 CUT&RUN signals on merged peaks were used as input data.

