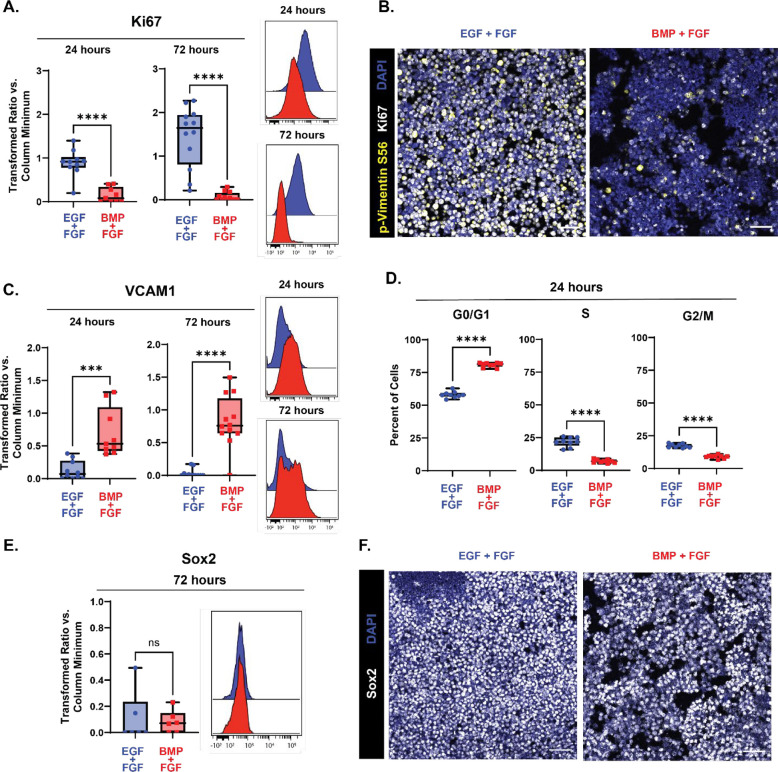
Figure 2: Exposure to BMP4 induces quiescence in embryonic NSCs in vitro.
Quantification of proliferation and quiescence markers in E15.5 NSC cultures grown for 24 (left in plots) and 72 (right in plots) hours with media containing EGF/FGF (blue) or BMP4/FGF (red). For all plots, the Y axis depicts the arcsinh transformed ratio versus column minimum for a particular antigen. A difference of 0.4 corresponds to an approximately 2-fold difference of total protein. Representative histograms of 24 (top) and 72 hours (bottom). For all plots, error bars contact the maximum and minimum values. For Ki67 and VCAM1, at 24 hours N = 10 for EGF/FGF, N = 9 for BMP4/FGF; at 72 hours N = 12. (A) Quantification of levels of Ki67 (24 hours: unpaired two-tailed t- test p < 0.0001; 72 hours: unpaired two-tailed t-test p < 0.0001). (B) 20X representative images of E15.5 NSCs cultured in media with EGF/FGF (left) or BMP4/FGF (right) for p-vimentin S56 (yellow), Ki67 (white), and DAPI (blue). (C) Quantification of levels of VCAM1 (24 hours: unpaired two-tailed t- test p = 0.0003; 72 hours: unpaired two-tailed t-test p < 0.0001). (D) Percent of E15.5 NSC cultures grown for 24 hours with media containing EGF/FGF (blue) or BMP4/FGF (red) in each phase of the cell cycle. (N = 9, G0/G1 phase unpaired two-tailed t-test p < 0.0001, S phase unpaired two-tailed t-test p < 0.0001, G2/M unpaired two-tailed t-test p < 0.0001). (E) Quantification of levels of Sox2 (N = 6, Mann-Whitney test p = 0.6688). (F) 20X representative images of E15.5 NSCs cultured in media with EGF/FGF (left) or BMP4/FGF (right) stained for Sox2 (white) and DAPI (blue). Scale bars for all 20X images = 50 μm.

