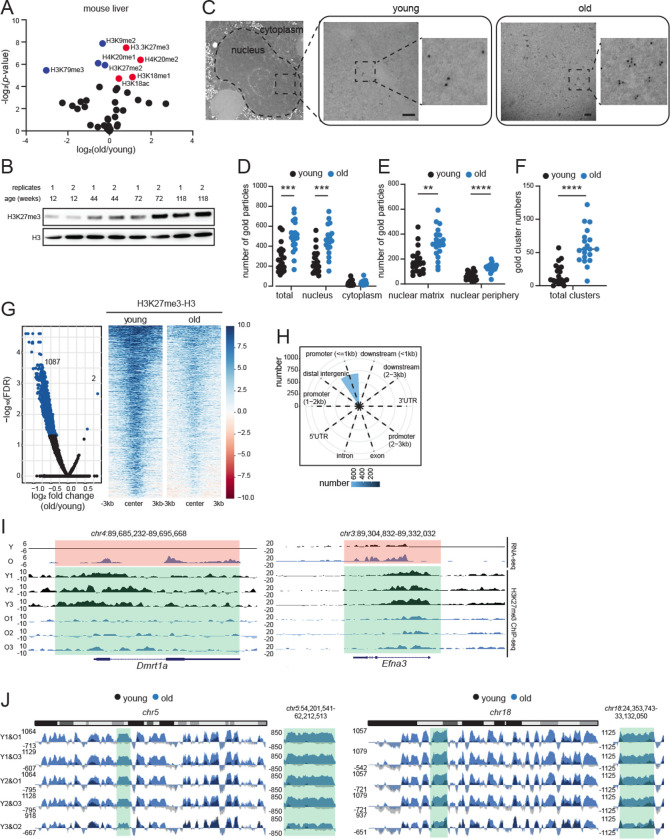
Fig. 1: H3K27me3 increases during aging and forms age-domains.
(A) Volcano plot of single hPTMs in old vs young livers. The significantly increased (red) and decreased (blue) modifications are labeled (two-tailed unpaired t-test). (B) Western blot of H3K27me3 and H3 in liver lysates from mice of different ages as indicated (n=2 biological replicates per age group). (C) Representative TEM images of young and old hepatocytes with immunogold labeling of H3K27me3 (n=2 biological replicates per group). Scale bar is 100 nm. (D) Subcellular location of gold particles. (E) Subnuclear location of gold particles. (F) Quantification of clusters (i.e., ≥3) of gold particles. Data are summarized as mean ± S.E.M with each dot representing one cell. ** p<0.01, *** p<0.001 and **** p<0.0001 from a Kolmogorov-Smirnov test with corrections for multiple comparisons. (G) Volcano plot (left) and heatmap (right) of DiffBind output. Significantly different H3K27me3 peaks (FDR<0.05) are indicated in blue. (H) Annotation of differential peaks identified in (G). (I) Genome browser snapshots of two differential peak regions from (G). Green regions show age-related loss of H3K27me3, and orange regions show de-repression of genes. (J) Genome browser shot of overlayed H3K27me3 ChIP signal (H3 subtracted and E. coli spike-in normalized) over chr5 (left) and chr18 (right) in sex-matched pairs of young and old mouse livers. Green area is expanded on the right of each chromosome.

