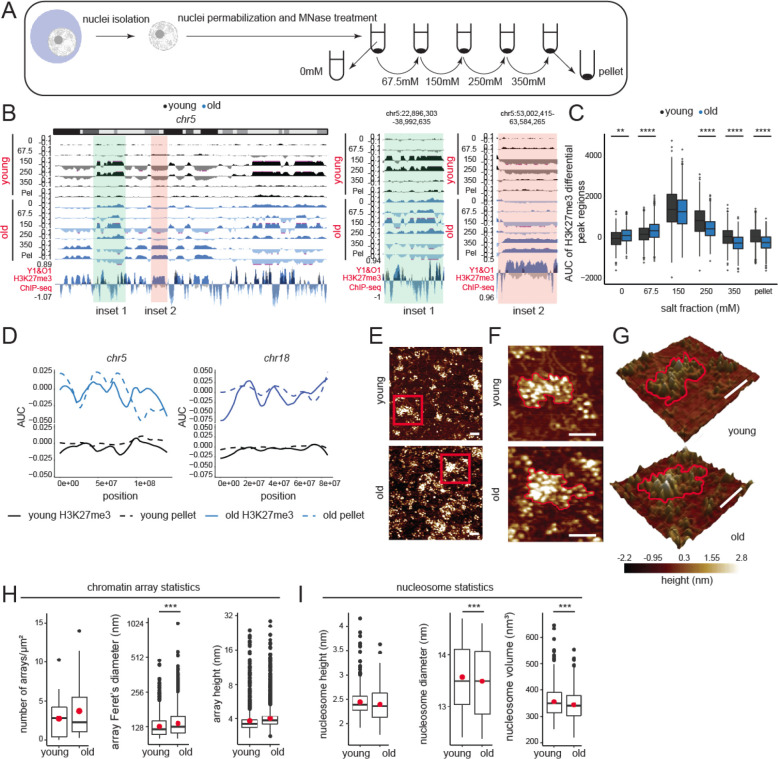
Fig. 2: Age-domains are heterochromatinized while H3K27me3 peak regions are euchromatinized during aging.
(A) Schematic of salt fractionation experiment (n=2 replicates per group). (B) Genome browser snapshot of salt fraction enrichments on chr5. Inset 1 (green) is euchromatinized and inset 2 (orange) is heterochromatinized with age and expanded on the right. (C) The salt elution profile of differential peaks in Fig. 1G. ** p<0.01, **** p<0.0001 from a Welch’s t-test. (D) H3K27me3 AUC (solid line) and salt fraction (dotted line) over chr5 and chr18 depicted as fraction of maximum. (E) Representative AFM images of chromatin arrays extracted with 67.5 mM salt (n=3 biological replicates per group). (F) The red boxed region in (E) is magnified. An array in each sample is highlighted with a red contour. (G) Same as (F) but represented as a 3D image. For (E-G), scale bar is 100 nm. (H) Chromatin array number per μm2, Feret’s diameter, and array height. (I) Nucleosomal height, diameter, and volume. For H-I, the red dot represents the mean. *** p<0.001 from a Welch’s t-test.

