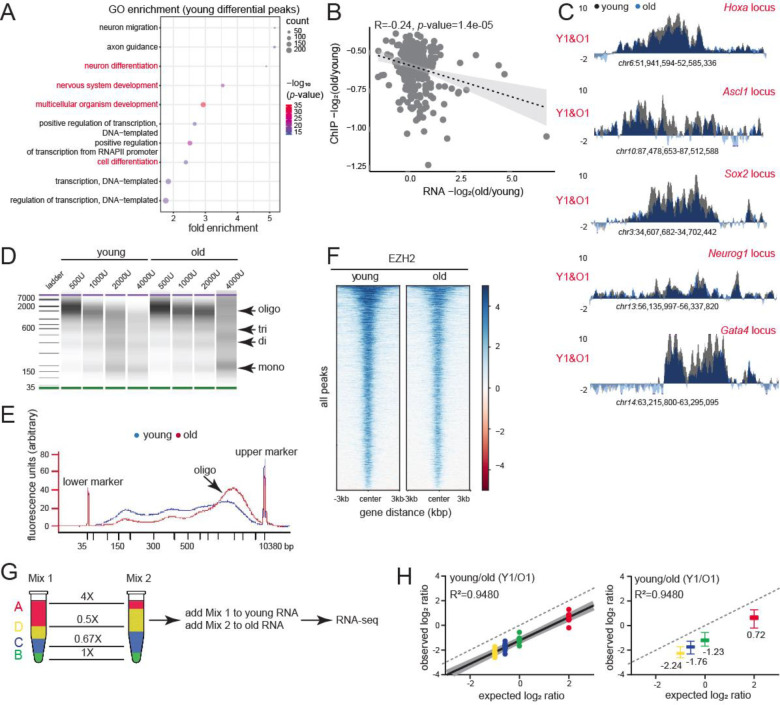
Fig. 3: Consequences of H3K27me3 genomic redistribution in aging.
(A) GO terms associated with differential peaks in Fig. 1G. Development and differentiation terms are indicated in red. (B) Negative correlation between H3K27me3 and gene expression change in old vs young. (C) H3K27me3 ChIP-seq profiles at indicated loci in young and old livers. (D) BioAnalyzer profiles of fixed chromatin from young and old livers digested with increasing units of MNase. (E) The digestion profile with 2000U of MNase shown as an overlayed trace. (F) Heatmap showing EZH2 signal at all called peaks in young and old livers. (G) ERCC Exfold transcript abundance and overall spike-in strategy. A-D represent the 4 groups of transcripts present in Mix 1 and 2. (H) Observed vs expected plot of Mix1/Mix2 log ratio for one pair of sex-matched young and old animals before resection. The dotted line represents a hypothetical experiment where the observed Mix1/Mix2 ratio is the same as expected. On the right, same data shown as box plots with median values indicated.

