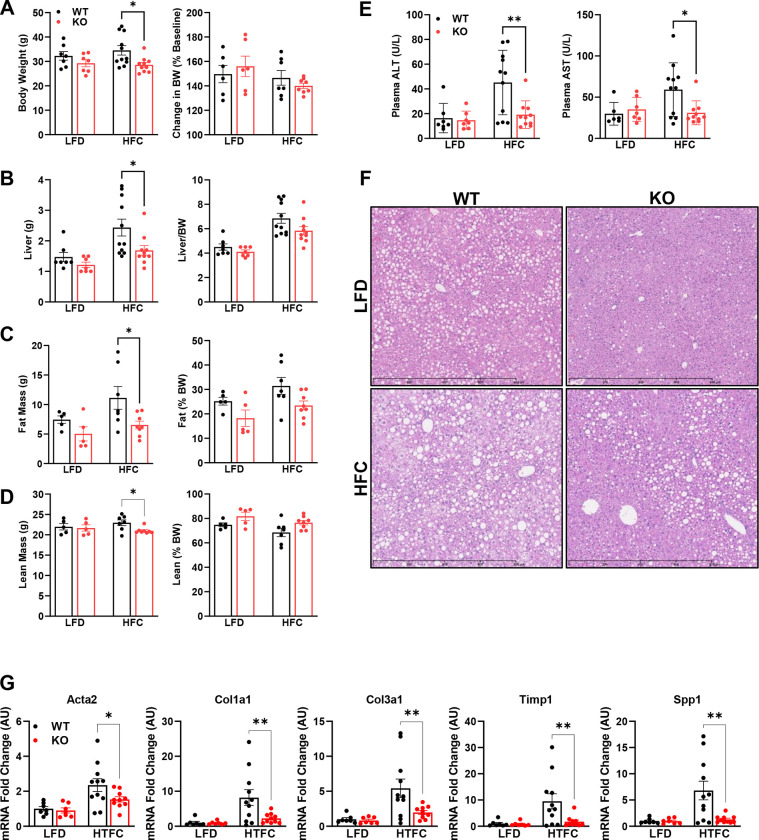
Figure 3: Lrat-Mpc2−/− mice are protected from NASH-inducing diet.
At about 8 weeks of age, littermate wild-type (WT) and Lrat-Mpc2−/− (KO) mice were placed on either a low-fat diet (LFD) or a NASH-inducing diet (high in fat, fructose, and cholesterol; HFC) for a period of 12 weeks. To exacerbate NASH progression, we treated mice with a one-time dose of carbon tetrachloride after four weeks on diet. (A) Terminal body weight, expressed as total mass and percent body weight gain from initiation of diet. (B) Liver weight measured at sacrifice, expressed as total mass and percent body weight. Body composition determined by EchoMRI for both (C) fat mass and (D) lean mass, represented as total mass and percent body weight. (E) Plasma levels of circulating transaminases ALT and AST collected at sacrifice. (F) Representative liver sections with H&E staining. (G) Hepatic gene expression measured by qRT-PCR and expressed relative to WT LFD control group. All data expressed as mean ± SEM (n=7–11/group). *p<0.05, **p<0.01.

