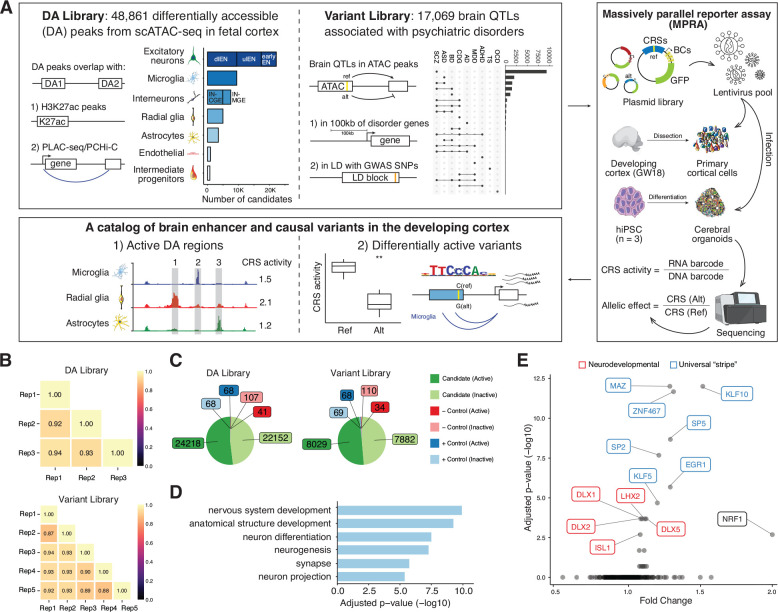
Fig. 1. Design and overall lentiMPRA results.
(A) Experimental overview of the two lentiMPRA libraries. Library 1 contains 48,861 differentially accessible (DA) regions from scATAC-seq in the developing human cortex that either overlap H3K27ac peaks or PLAC-seq/PCHiC loop. The number of DA candidates for each cell type was portrayed in the bar plot. dlEN, deep layer excitatory neuron; ulEN, upper layer excitatory neuron; IN-CGE, CGE derived interneuron; IN-MGE, MGE derived interneuron. Library 2 includes 17,069 brain QTLs that are 100kb from differentially expressed cross-disorder neurodevelopmental genes or in linkage disequilibrium (LD) with psychiatric disorder GWAS SNPs. The number of variants associated with each disorder is shown in the upset plot (top 22 intersects shown). SCZ, schizophrenia; ASD, autism spectrum disorder; BD, bipolar disorder; CDG, congenital disorders of glycosylation; AD, Alzheimer’s disease; MDD, major depressive disorder; ADHA, attention-deficit/hyperactivity disorder; TS, Tourette syndrome; OCD, obsessive-compulsive disorder. Both libraries were cloned into a lentiMPRA vector and packaged into lentivirus and used to infect primary cortical cells dissociated from GW18 tissues and human induced pluripotent cell (hiPSC)-derived cerebral organoids. Following infection, DNA and RNA were extracted and sequenced and an RNA/DNA barcode count ratio was calculated for each candidate regulatory sequence (CRS) allowing the identification of active DA regions and differentially active variants. (B) Correlation of log2(RNA/DNA) between technical replicates in primary cortical cells for library 1 and 2, respectively. (C) Pie charts showing the number of active and inactive sequences for candidates, positive (+) and negative (−) controls in both libraries. (D) Top enriched GO terms from the ‘Biological Process’, ‘Cellular Component’ and ‘Molecular Function’ ontologies for nearest genes of the highest activity sequences (both libraries combined). Closest genes of the lowest activity sequences were used as the background set. The complete list of GO terms is available in fig. S2B. (E) TF motif enrichment analysis for highest activity sequences (both libraries). Red: neurodevelopmental TFs, Blue: USFs.

