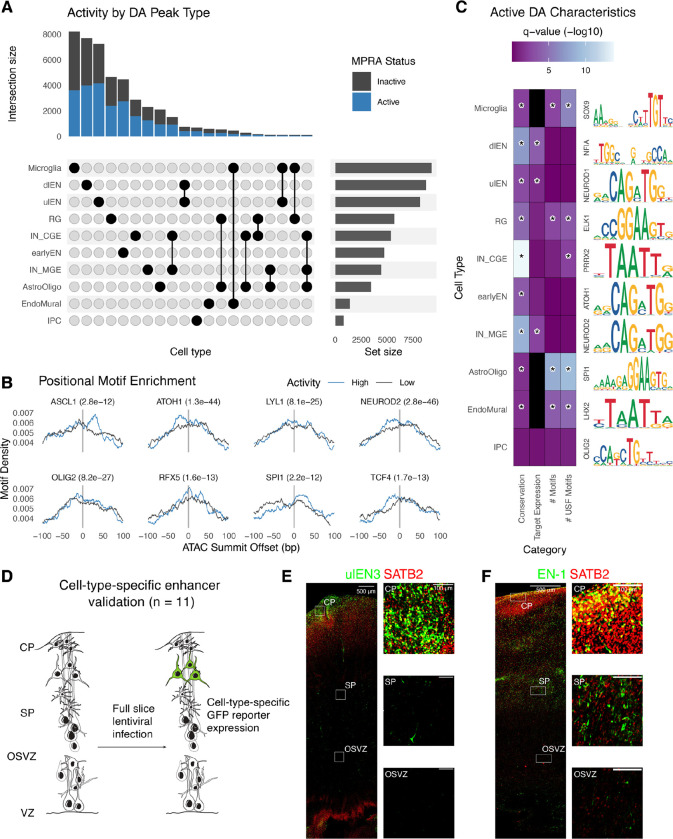
Fig. 2. Identification and validation of functional differentially accessible regions in the developing cortex.
(A) Upset plot showing the number of DA peaks (active: blue; inactive: gray) for each cell type or combination of cell types. (B) The highest activity DA sequences have positional motif enrichment for neurodevelopmental TFs compared to the lowest activity sequences, exhibiting significantly more motif matches slightly up- or downstream of the ATAC-seq peak summit. (C) Active DA sequences have significantly higher means across several attributes compared to inactive DA sequences (color scale: Wilcoxon test q-values, black = no data) including evolutionary conservation (phyloP), expression of PLAC-seq linked target genes in matched cell types, total number of strong motif matches (q-value < 0.01), and total number of strong USF motif matches. A representative motif enriched in active DA peaks for each cell type is shown on the right. Statistically significant comparisons (q-value < 0.05) are indicated by a star. (D) Experimental strategy for validating cell type specificity of active DA sequences. (E-F) Mid-gestation human cortex slice cultures transduced with a GFP lentivirus reporter driven by a ulEN-specific enhancer (chr5:89274678-89274948, hg38) (E) and a pan-excitatory neuron specific enhancer (chr2:165141999-165142269, hg38) (F). Expression of GFP (green) and SATB2 (red) was visualized via immunohistochemistry staining and insets show colocalization of GFP+ along with SATB2+ cells in different layers.

