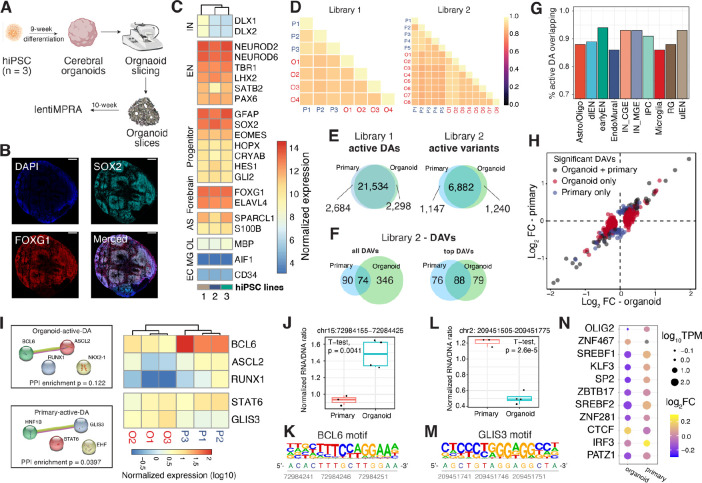
Fig. 4. Comparison of lentiMPRA results in cerebral organoids and primary cortical cells.
(A) Schematic of the experimental workflow. (B). Microscopic images of 10-week-old organoid slices immunostained for SOX2 (Cyan), FOXG1 (Red), and DAPI. Scale bar, 200 μm. (C) Normalized transcript count of marker genes in organoids derived from 3 hiPSC lines (1 = 21792A, 2 = 1323_4, 3 = 20961B). (D) Correlation of log2(RNA/DNA) between replicates in organoids and primary cortical cells for library 1 and 2, respectively. (E-F) Venn diagrams showing the overlap between organoids and primary cells. (E) Left: overlap of active DA regions; Right: overlap of active variants. (F) Overlap of DAVs. ‘Top DAVs’ were identified using shuffled sequences to define active and applying a cutoff for absolute log2FC of 0.3. (G) The proportion of active DAs in organoids that are also active in primary cells. (H) lentiMPRA log2FC in organoid (x-axis) and primary cells (y-axis). The scatter plot includes variants identified as DAVs in both organoids and primary cells (grey), variants detected as DAVs only in organoids (red), and variants detected as DAV only in primary cells (blue). (I) Left: Protein-protein interactions (PPI) of enriched TFBS motifs in active DAs specific to organoids or primary cells. PPI network generated using STRING (73) database. Right: heatmap showing the normalized transcript count of enriched TFs from bulk RNA-seq data. TFs not expressed (TPM < 1) in all replicates were removed from the heatmap. (J-K) A DAV (chr15:72984155-72984425, hg38) that contains a BCL6 motif showed increased activity in organoids versus primary cells (J) and its reference sequence contains a BCL6 motif (K). (L-M) A DAV (chr2: 209451505-209451775, hg38) with GLIS3 binding motif showing increased MPRA activity in primary cells versus organoids (L) and the location of the GLIS3 motif in its reference sequence shown below (M). (N) TFBSs altered by DAVs that show an opposite direction of allelic effect between organoids and primary cells. Dot sizes represent normalized TF expression; color represents log2FC.

