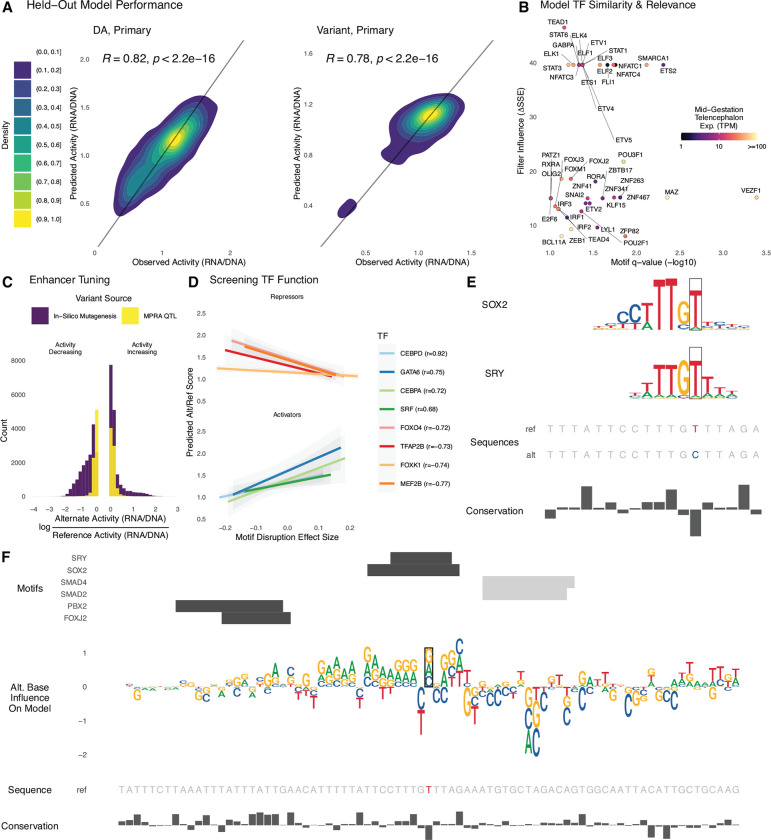
Fig. 5. Sequence determinants of lentiMPRA activity can be modeled with deep learning.
For each library, we trained a deep learning model to predict lentiMPRA activity in primary cells from sequence alone. (A) Sequences on chromosome 4 were held out from model training and used to evaluate model performance. Predicted and measured activity have high Pearson correlation for the DA library (left) and variant library (right). (B) The model learned motifs of neurodevelopmental TFs and used them for accurate predictions. Predictive importance of convolutional filters (change in sum of squared errors when fixing filter output to zero) is plotted against significance of matches to HOCOMOCO motifs (TOMTOM q-value < 0.1) for TFs expressed in mid-gestation telencephalon (mean CPM > 1). (C) Applying ISM to the variant library, we found that the activity of most enhancers can be tuned up and down through introduction of alternative alleles. The largest activity-increasing and activity-decreasing alleles for each sequence (purple) tend to have bigger effects than the lentiMPRA measured effects for QTLs (yellow). (D) We combined ISM with motifbreakR TFBS disruption scores to screen TFs for repressor versus activator function in neurodevelopment, using the most activity-increasing alternative allele for each sequence in the variant library. TF’s where predicted activity is anti-correlated with motif score tend to repress expression (top) and those with a positive correlation tend to be known activators (bottom). This relationship can be used to decode if the model has learned an activator versus repressor role for TFs that function in both ways. (E) The reference T allele of eQTL rs2883420 (lentiMPRA RNA/DNA 0.8) matches motifs of repressors SRY and SOX2, while the alternate C allele disrupts a high information content position in both motifs, resulting in a large activity increase (lentiMPRA RNA/DNA = 0.97, predicted RNA/DNA = 0.96). (F) ISM predicts that the other two possible alleles at rs2883420 also increase activity (middle, sequence logo indicates magnitude and direction: up=increasing, down=decreasing). Alternative alleles at adjacent nucleotides overlapping TF motifs (top, positive strand = black, negative strand = gray) have even larger predicted effects on activity. Region shown is chr10:86,851,230–86,851,500 (hg38).

