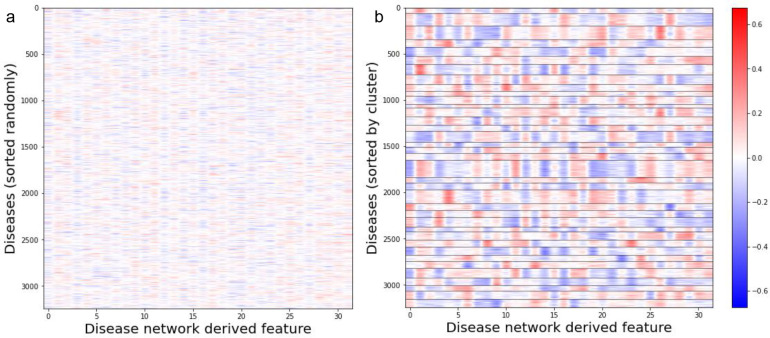
Figure 2:
Disease embedding vectors are plotted in heatmaps (a)randomly sorted and (b)sorted by cluster. Each column in the heatmap corresponds to a dimension within the embedding vector space and each row corresponds to a disease. In figure b, the clusters are demarcated with horizontal black lines.

