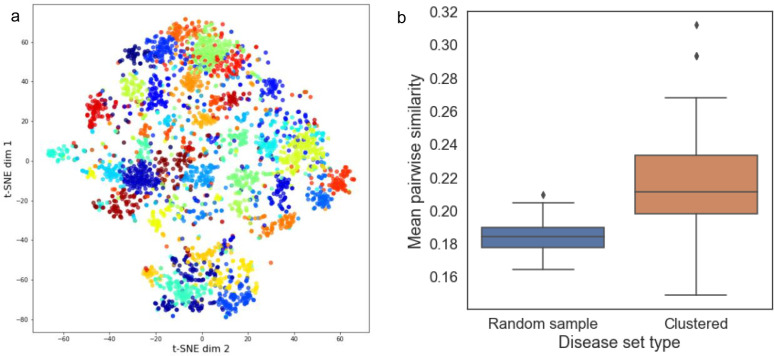
Figure 3:
Visualizing and quantifying similarity within disease clusters. (a) t-SNE projections of the disease embedding vectors were created and plotted, points are colored according to their cluster membership. (b) The average pairwise Sanchez semantic similarity metric amongst disease within each cluster or within random samples.

