
Figure 1. Ketogenic diet slows down tumor growth but shortens overall survival in C26 and KPC murine models of cancer cachexia.
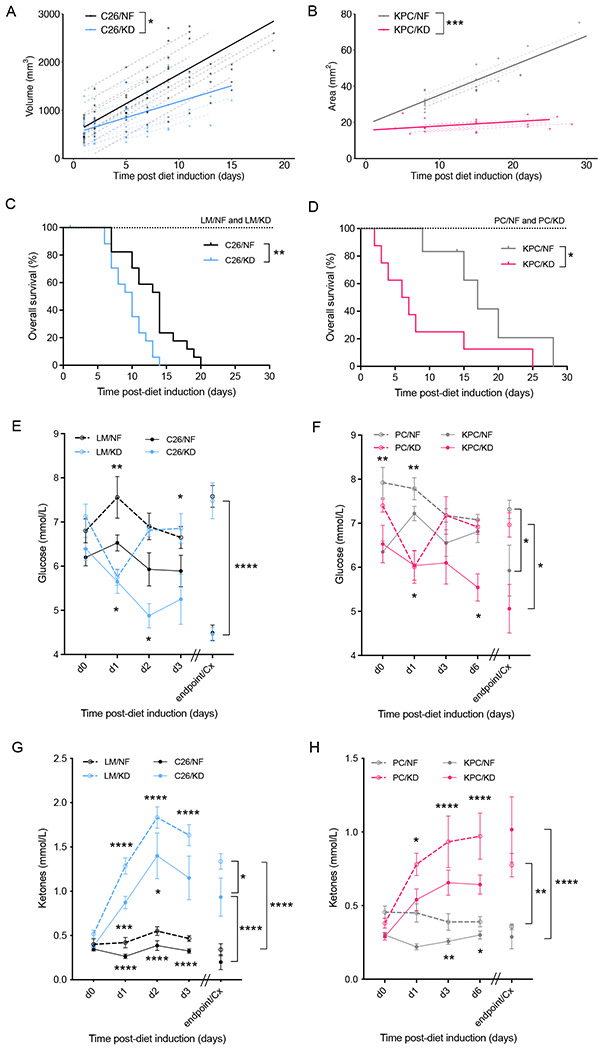
(A) Longitudinal tumor volume in C26 tumor-bearing mice fed ketogenic (KD) or standard (NF) diets (n=12). (B) Longitudinal tumor area in KPC tumor-bearing mice fed KD or NF (n=8). (C) Overall survival of C26 tumor-bearing mice and littermate controls on KD or NF (n=7 LM, n=17-18 C26). (D) Overall survival of KPC tumor-bearing mice and PC controls fed KD or NF (n=6-8). (E-F) Longitudinal glucose measurements from day 0 of diet change to cachectic endpoint in C26 tumor-bearing mice and littermate controls (n=5 LM, n=20 C26) (E), and in KPC tumor-bearing mice and PC controls (n=10) (F), fed either KD or NF diets. (G-H) Longitudinal ketone measurements from day 0 of diet change of cachectic endpoint in C26 tumor-bearing mice and littermate controls (n=5 LM, n=20 C26) (G), and in KPC tumor-bearing mice and PC controls (n=10) (H), fed either KD or NF diets.
Data are expressed as the mean ± SEM. Overall survival (OS): time until mice reach >15% bodyweight loss. Differences in (A-B) were assessed by fitting a mixed effect model with coefficients for the intercept, slope and the difference in the slope between diets, and a random component for each individual mouse. Kaplan–Meier curves in (C-D) were statistically analyzed by using the log-rank (Mantel–Cox) test. Two-way ANOVA statistical tests with Tukey’s correction for post hoc comparisons were performed in (E-H). * p-value < 0.05, ** p-value < 0.01, *** p-value < 0.001, **** p-value < 0.0001.