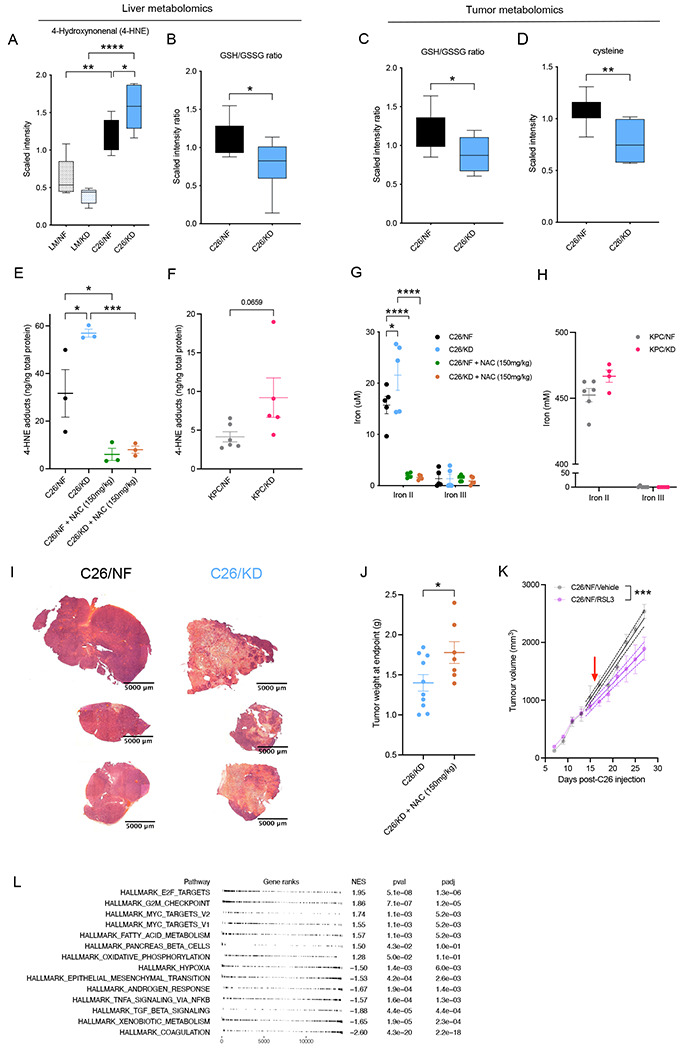
Figure 2. Ketogenic diet induces ferroptotic cell death of cancer cells that can be prevented by NAC.

(A-B) Quantification by UPLC-MS/MS of 4-hydroxynonenal (4-HNE) and GSH/GSSG ratio (B) in the liver of C26-tumor bearing and littermate controls on KD or NF diets (n=7). (C-D) Quantification by UPLC-MS/MS of GSH/GSSG ratio (C) and cysteine (D) in the tumor of C26 mice (n=7). (E) Detection of 4-HNE adducts in tumor lysates from C26 tumor-bearing mice untreated or treated with N-acetyl cysteine (NAC) and fed KD or NF (n=3). (F) 4-HNE adducts formation in tumor of KPC mice fed KD or NF (n=4-6). (G-H) Concentration of ferric (III) and ferrous (II) iron in the tumor of C26 mice fed KD or NF, untreated or treated with NAC intraperitoneally (n=5) (G), and in tumors of KPC mice fed either diet (n=6) (H). (I) Haematoxylin and eosin (H&E) staining of tumors from C26 mice fed KD or NF. (J) Weight of tumors at the time of cachexia in C26 tumor-bearing mice fed KD untreated or treated with NAC (n=7-10). (K) Longitudinal tumor volume of C26 mice fed standard diet and treated with RSL3 or vehicle control (n=4-6). (L) GSEA of upregulated and downregulated pathways in tumors of KPC mice fed KD compared to KPC fed NF (n=5).
Data are expressed as the mean ± SEM. One-way ANOVA with Tukey’s correction for post hoc testing was used in (A, E-G). Statistical differences in (B-D, H-I) were examined using an unpaired two-tailed Student’s t-test with Welch’s correction. Simple linear regression model was applied to (J). Statistical analysis in (K) is described in Methods. * p-value < 0.05, ** p-value < 0.01, *** p-value < 0.001, **** p-value < 0.0001.
