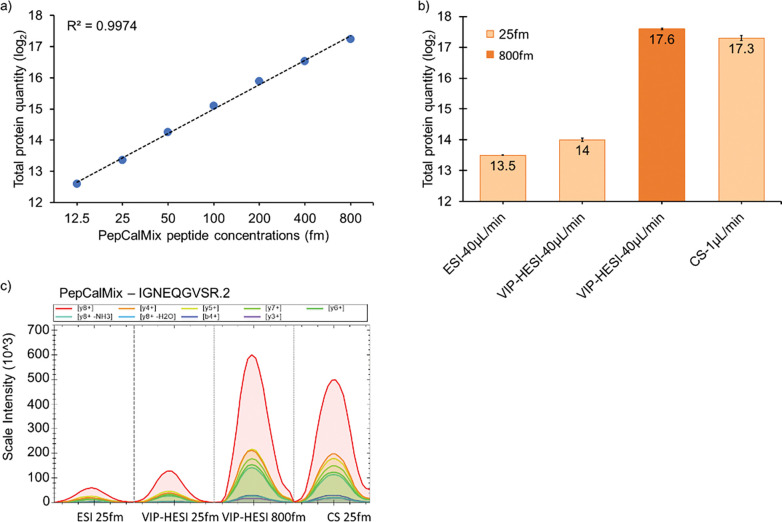
Figure 1. Evaluation of the linearity and sensitivity comparison of VIP-HESI, ESI, and CS ion source setups using PepCalMix measurements.
a) Line graph of PepCalMix peptides to assess the linearity measured by dia-PASEF mode in timsTOF mass spectrometer. b) Bar plots of total quantities of all 20 PepCalMix peptides observed with ESI, CS ion sources at 25 fmol injection amount at 40 μL /min and 1 μL /min respectively, and with VIP-HESI source at 25 & 800 fmol injection amounts at 40 μL /min. Keeping the concentration of the eluting peak height constant (25 fmol for 1 μL = CS, 800 fmol for 40 μL for VIP-HESI), the response of VIP-HESI is even increased by 30% and a slightly higher peak response using the VIP-HESI source is observed. The error bars indicate the variability within three replicates represented as the standard error of the mean at the log2 scale. These are calculated as the ratio of the standard deviation of the peptide intensities observed with each source setup replicate to the square root of the sample size (n = 3). c) Extracted Ion Chromatogram (XIC) plots of a single precursor IGNEQGVSR.2 representing each source setup, colored by MS2 fragment intensity observed per measurement, as per the injection amount and flow rates.

