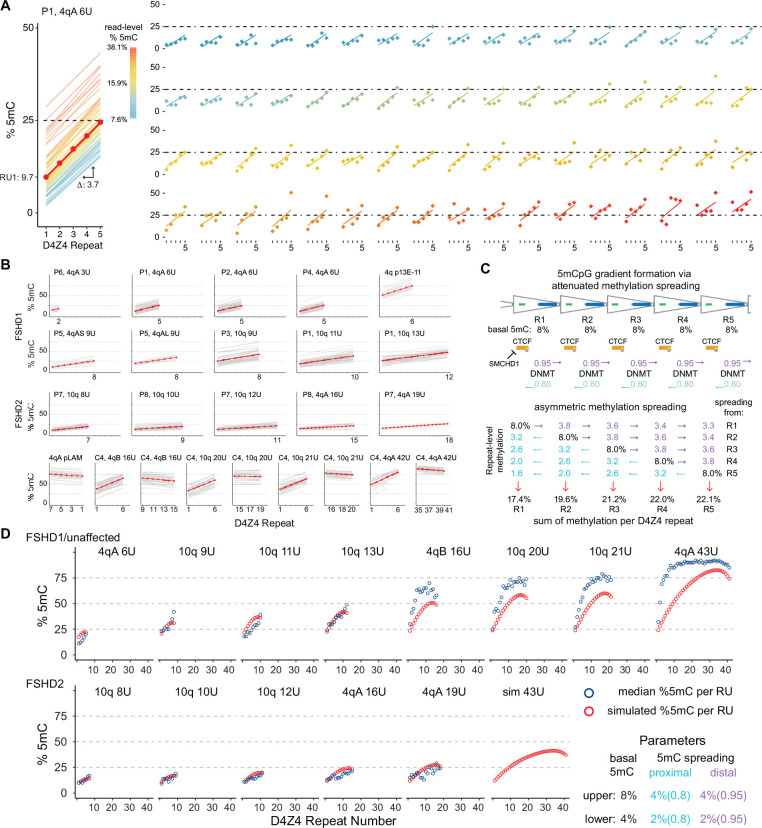
Figure 3. Methylation gradient modeling.
(A) Intercept and slope estimates from p13E-11 to pLAM 4qA 6U reads from participant P1. The red line is the model estimate and the thin lines are the individual read estimates with a color scale for read-level total % 5mC. The right panel shows the observed D4Z4 methylation frequencies for each read (points) with their individual read estimates. The 68 plots are ordered by read-level % 5mC. (B) Intercept and slope estimates as in (A) from FSHD1, FSHD2 participants, and control subject C4 (see Table 2). (C) Model for gradient formation via basal methylation followed by asymmetric spreading. (D) Predicted D4Z4 methylation levels from simulated basal methylation and spreading (red points) compared to observed values (blue points, mean methylation per repeat, data from (B)). In the lower panel, the basal methylation and spreading parameters were reduced by a factor of 2.

