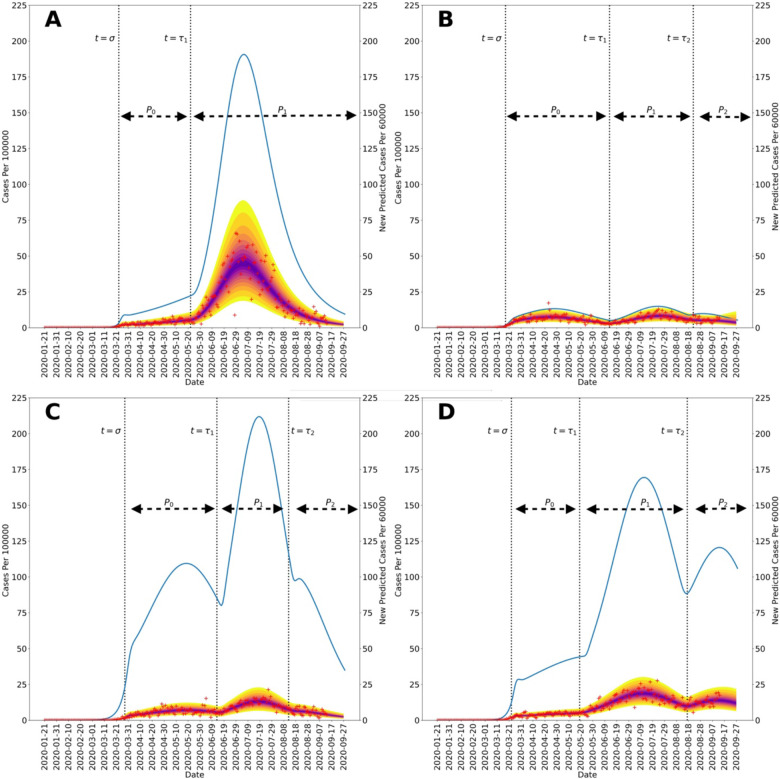
Figure 3:
Posterior predictive distributions for new cases in the four US states surrounding the Navajo Nation between 21-January-2020, and 14-September-2020: (A) Arizona, (B) Colorado, (C) New Mexico, and (D) Utah. Recorded region-specific daily new cases of COVID-19 are indicated by red markers in each panel. The median parameter posterior estimates are shown in purple. The yellow bands delimited the 2.5 and 97.5 percentiles; the entire shaded region indicates the 95% credible interval. In each panel, the blue curve indicates daily number of new infections and is based on MAP estimates for region-specific model parameters. The start times of NPI phases are indicated by vertical dotted lines. The initial NPI phase begins when t = σ, the second NPI phase begins when t = τ1, and the third NPI phase begins when t = τ2. The horizontal black dotted lines indicate durations of NPI phases. It should be noted that the size of the first surge in Arizona, occurring in March and April 2020, is dwarfed by the size of the second surge. It should be noted that the left and right vertical scales of each panel are different.

