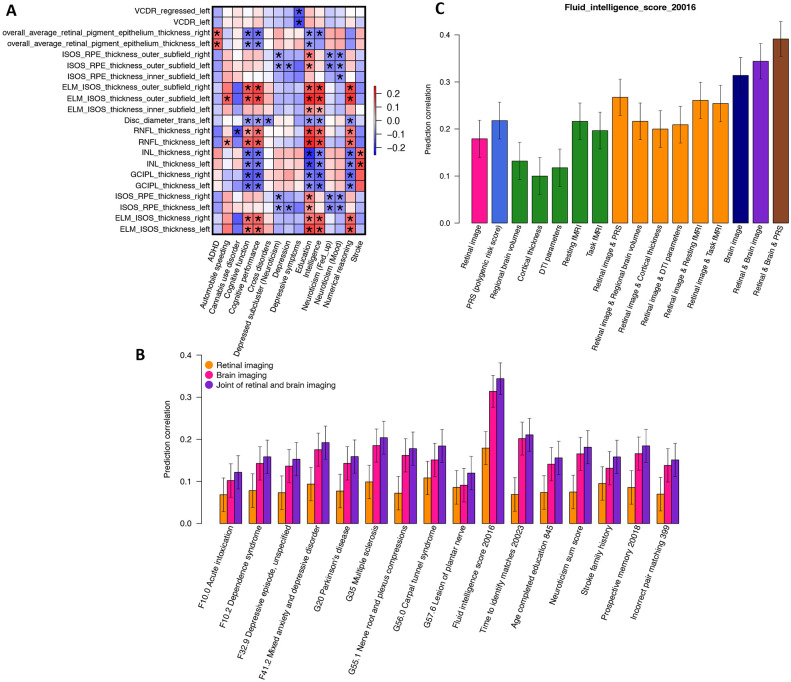
Fig. 6. Genetic correlations and prediction analysis.
(A) We show the selected genetic correlations between brain-related complex traits and diseases (x-axis) and retinal imaging traits (y-axis). The asterisks highlight significant genetic correlations after adjusting for multiple testing using the Benjamini-Hochberg procedure to control the FDR at 5% level. The colors represent genetic correlations. Table S1 provides more information on these retinal imaging traits. ADHD, attention-deficit/hyperactivity disorder. (B) Predicting brain phenotypes using both retinal and brain imaging traits. (C) The accuracy of fluid intelligence prediction using multiple data types. Retinal image, including all retinal imaging traits. DTI parameters, diffusion tensor imaging parameters; Brain image, including all brain imaging modalities.

