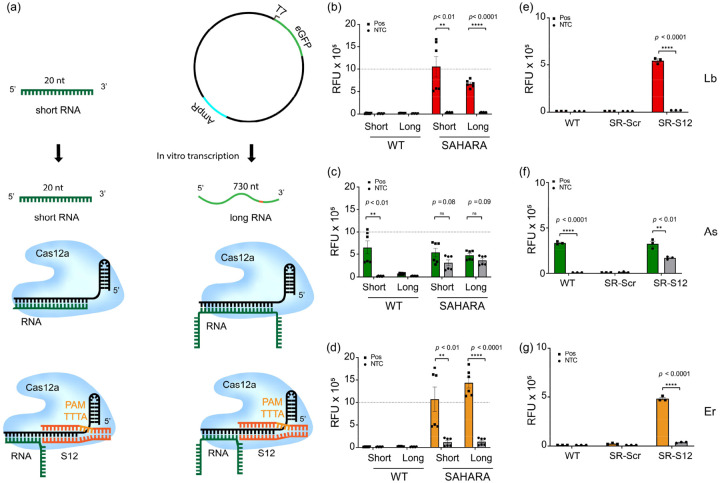
Fig. 3: Development of SAHARA for the detection of a wide range of RNA targets.
a. Schematic representation of Cas12a complexed with WT vs. SAHARA crRNA and activated by either a short (20-nt) or long (730-nt) RNA activators. b-d. Comparison of trans-cleavage activity among Cas12a orthologs for the short vs. long combinatorial schemes seen in (a). The plot represents raw fluorescence units (RFU) plotted for time t=60 min. e-g. Detection of RNA target with SAHARA by using either a non-targeting scrambled S12 (SR-Scr) or a targeting S12 (SR-S12). The plot represents RFU at t=60 min. All error bars represent SD (n=3). Statistical analysis was performed using a two-tailed t-test where ns = not significant with p > 0.05, and the asterisks (* P ≤ 0.05, ** P ≤ 0.01,*** P ≤ 0.001, **** P ≤ 0.0001) denote significant differences.

