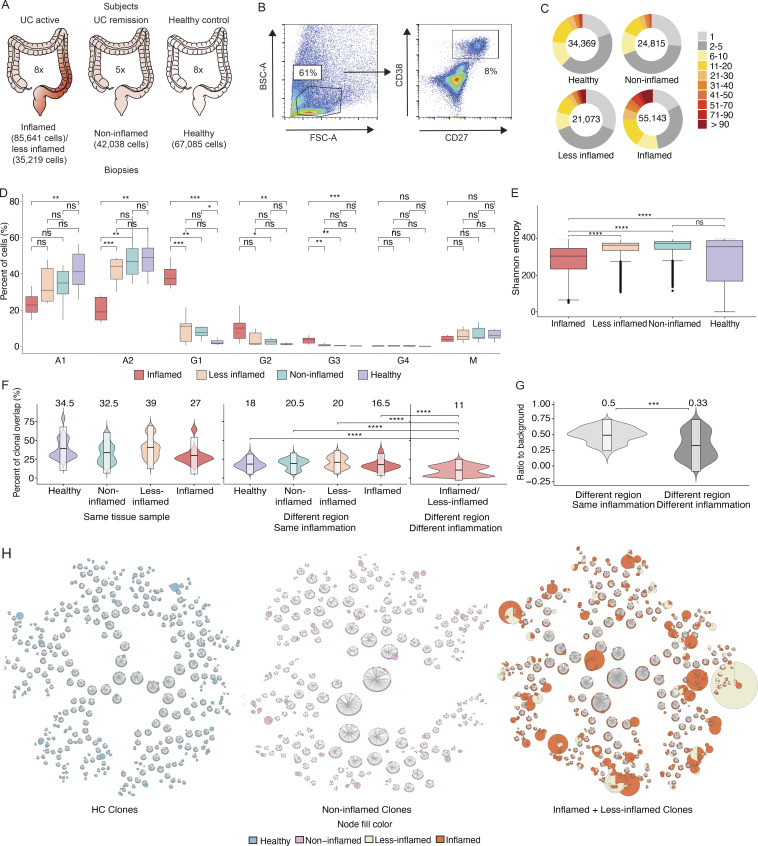
Figure 1.
Patient selection, PC sorting, isotype analysis, and clonal landscape. (A) Three patient categories recruited in this study with the number of subjects indicated in the center, respectively. Left: UC patients with inflammation; center: UC patients in remission; and right: HCs. The number of cells included in transcriptome analysis is indicated for each sample type. (B) Representative FACS plots with the gating strategy for the sorting of colon PCs. Cells isolated from digestion of colon biopsies and resection samples were gated on live cells based on their appearance in side scatter (BSC) and forward scatter (FSC). Of these, CD38-FITC and CD27-PE double-positive cells were selected for sorting and sequencing. (C) Pie charts show the expansion of differently sized PC clones for all samples grouped based on their inflammation status. Numbers in the center of the pie charts stand for the total number of cells analyzed in that particular plot. (D) Box plots displaying the distribution of the percentage of immunoglobulin isotypes (y axis) across samples grouped by their inflammation status (xaxis). Brackets indicate statistical significance using a one-sided non-parametric Wilcoxon test with *P ≤ 0.05, **P ≤ 0.01, ***P ≤ 0.001, ****P ≤ 0.0001, and ns indicating no statistical significance. Different samples taken from the same donor and with the same disease status are merged and represented as one data point in the distribution. (E) Box plots displaying the distribution of the Shannon entropy values of the PCs stratified by their inflammation status as indicated. Shannon entropy is a measure of population diversity, which is reversely related to the clonal expansion (Materials and methods). Brackets indicate statistical significance using a one-sided t test with ****P ≤ 0.0001, and ns indicating no statistical significance. (F) Violin plots displaying the distribution of the percentage of the shared clones between randomly sampled sets of PCs (n = 100; Materials and methods). Here, the two random samples of a specific donor that are to be evaluated for clonal overlap can belong to (i) same tissue sample (left), (ii) different colon regions with the same inflammation status (center), and (iii) different colon region with different inflammation status (right). The overlap between random samples that belong to different colon regions with the same inflammation status is significantly smaller (P value ≤ 0.0001, one-sided t test) than the random samples that belong to the same colon regions for all healthy, non-inflamed, less-inflamed, and inflamed groups. The overlap reduces significantly (P value ≤ 0.0001, one-sided t test) when the compared samples differ in their inflammation status. The boxes represent −2 SD, mean, and +2 SD. The values above each violin plot represent the median values of the distribution. (G) Distribution of the clonal overlap between randomly sampled PCs (n = 100) that are collected from different colon regions corrected for the background overlap percentages of the parent regions (Materials and methods). Bracket indicates statistical significance using a one-sided t test with ***P ≤ 0.001. The boxes represent −2 SD, mean, and +2 SD. The values above each violin plot represent the median values of the distribution. (H) Schematic representation of the B cell clones in healthy, non-inflamed, and inflamed samples, as indicated, show the clonal expansion and the isotype change in UC patients. Up to 50 of the largest clones from each donor are displayed. Each ring shows one distinct clone where the cells of the clone are depicted as individual nodes lined at the border of the clone ring and connected to each other by lines. The sizes of the nodes correspond to the number of the cells with the identical VDJ heavy chain sequence. The fill colors of the nodes indicate the inflammation status of the samples these particular cells belong to.

