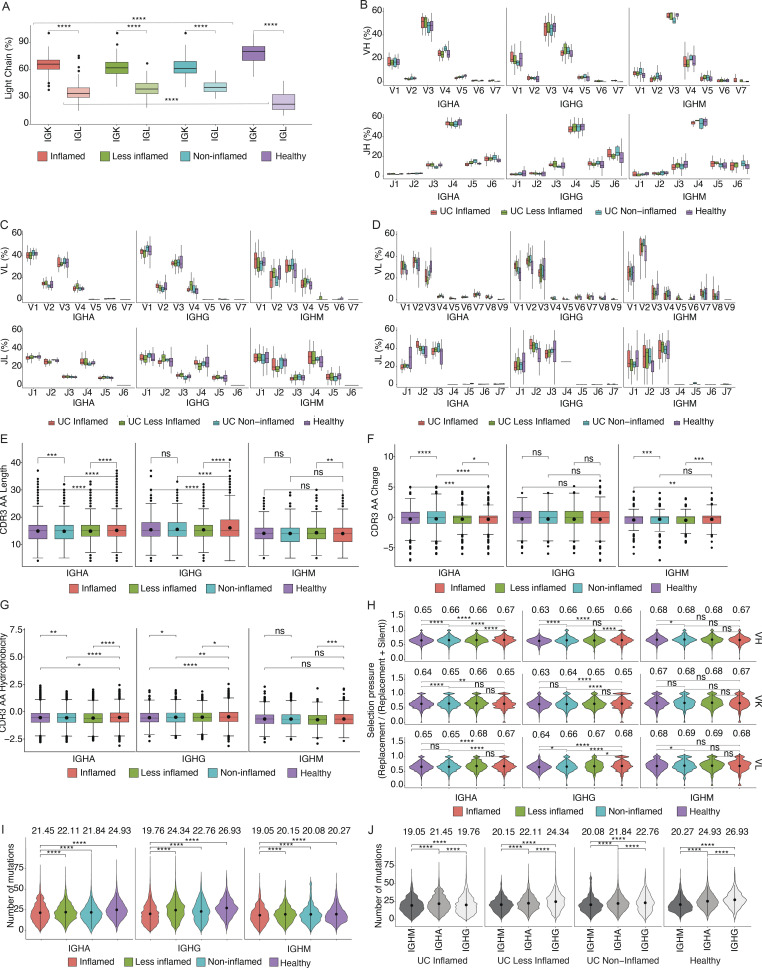
Figure 3.
Colon PC antibody repertoire. Statistically significant differences are indicated with brackets. (A) Box plots display antibody light chain usage with kappa light chains shown in dark and lambda light chains in light colors. Antibodies are stratified by the disease state of the source tissue as indicated. Brackets indicate statistical significance using a one-sided non-parametric Wilcoxon rank-sum test, ****P ≤ 0.0001. (B–D) Box plots showing the V- and J-gene usage of antibody heavy chains (B), kappa light chains (C), and lambda light chains (D) as indicated. Red plots represent antibodies derived from PCs in inflamed tissue, green plots represent antibodies from less-inflamed tissue of UC patients with inflammation, turquoise plots represent antibodies from non-inflamed tissue in UC patients in remission, and purple plots represent antibodies from HCs. (E–G) Box plots displaying the CDRH3 amino acid length (E), CDRH3 amino acid charge (F), and CDRH3 amino acid hydrophobicity (G) of antibody heavy chains from PCs isolated from HCs (purple), non-inflamed tissue from UC patients in remission (turquoise), less-inflamed tissue from UC patients with inflammation (green), and inflamed tissue (red). Sequences were stratified based on antibody isotype. Brackets indicate statistical significance using a two-sided t test with **P ≤ 0.01, ***P ≤ 0.001, ****P ≤ 0.0001, and ns, non-significant. (H) Violin plots showing selection pressure (nucleotide replacement mutation/nucleotide replacement + silent mutation) in antibody heavy chain V-genes (top row), kappa light chain V-genes (middle row), and lambda light chain V-genes (bottom row). Data are stratified based on the disease state of the source tissue and antibody isotype as indicated. Brackets indicate statistical significance using a one-sided Wilcoxon rank-sum test with *P ≤ 0.05, **P ≤ 0.01, ****P ≤ 0.0001, and ns, non-significant. (I and J) Violin plots showing the distribution of the number of mutations in IgM, IgA, and IgG isotypes, stratified by the disease states. Black dots and lines display the mean values which are also written as text and ±1 SDs, respectively. Brackets display the P values obtained by two-sided Wilcoxon rank-sum test with ***P ≤ 0.001 and ****P ≤ 0.0001.

