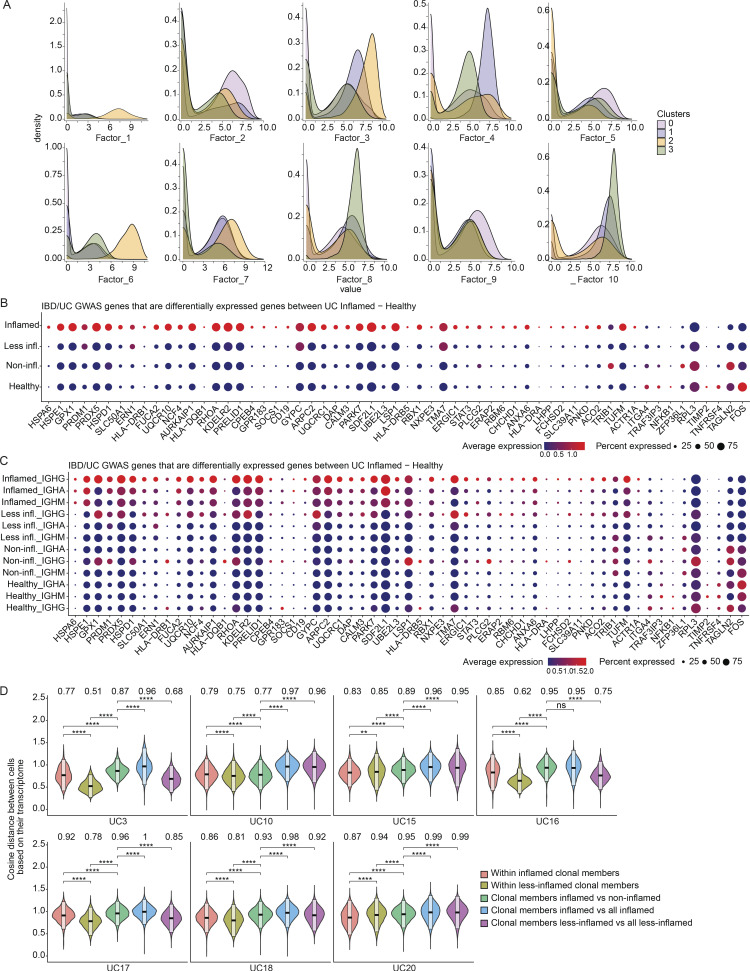
Figure 5.
Expression levels of genes that are associated with IBD or UC through GWAS. (A) Stacked density plots displaying the distribution of cell factor scores stratified by the expression clusters. (B and C) Dot plots showing the relative expression of the selected genes (Buckner et al., 2014; Huang et al., 2017; de Lange et al., 2017; Liu et al., 2015) when comparing PCs derived from inflamed tissue with PCs from less-inflamed, non-inflamed, and HCs (y axis). In C, each disease state is stratified by antibody isotype. Each dot encodes both the detection rate and average gene expression in detected cells for a gene in a cluster. As indicated, the dark red color indicates higher average gene expression from the cells in which the gene was detected, and a larger dot diameter indicates that the gene was detected in a greater proportion of cells from the cluster. (D) Comparison of the pairwise cosine distances between PCs based on their transcriptome for each subject with inflamed and less-inflamed samples. Groups from left to right display the PC pair distance distributions between (i) inflamed clone members, (ii) less-inflamed clone members, (iii) inflamed and less-inflamed clone members, (iv) inflamed clone members and 100 randomly selected PCs of the donor that are inflamed and are not clone members, (v) clone members of less-inflamed samples and 100 randomly selected PCs of the donor that are less-inflamed and are not clone members. Brackets indicate statistical significance using a one-tailed t test with **P ≤ 0.01, **P ≤ 0.001, ****P ≤ 0.0001, and ns, non-significant.

