Figure 6.
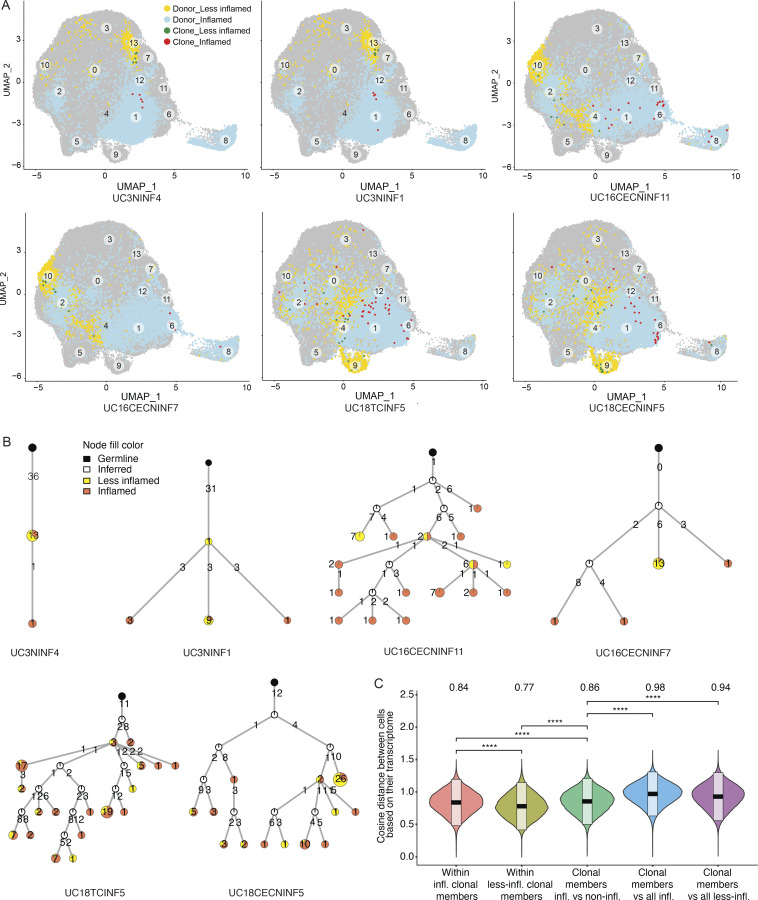
Transcriptomics of selected PC clones. (A) UMAP plots highlighting clonal members of six selected PC clones from three different subjects as indicated (Table S5). PCs from inflamed and less-inflamed colon areas from the respective subject are highlighted in blue and yellow, respectively. Red dots indicate clonal members belonging to the selected clone from inflamed colon areas and green dots from less-inflamed colon areas. (B) Phylogenetic trees summarize the clonal relationship of all members within the selected clones. Trees are rooted on a theoretical germline member (black node), uncolored nodes indicate inferred intermediates, and yellow and orange node colors indicate clonal members from less-inflamed or inflamed colon areas, respectively. Numbers on the connecting lines indicate the number of heavy chain mutations separating two nodes. (C) Comparison of the pairwise cosine distances between PCs based on their transcriptome. Groups from left to right display the PC pair distance distributions between (i) inflamed clone members, (ii) less-inflamed clone members, (iii) inflamed and less-inflamed clone members, (iv) inflamed clone members and 100 randomly selected PCs of the donor that are inflamed and are not clone members, (v) clone members of less-inflamed samples and 100 randomly selected PCs of the donor that are less-inflamed and are not clone members. There is a significant difference between transcriptional distances between clone members based on their inflammation type. Brackets indicate statistical significance using a one-tailed t test with ****P ≤ 0.0001.

