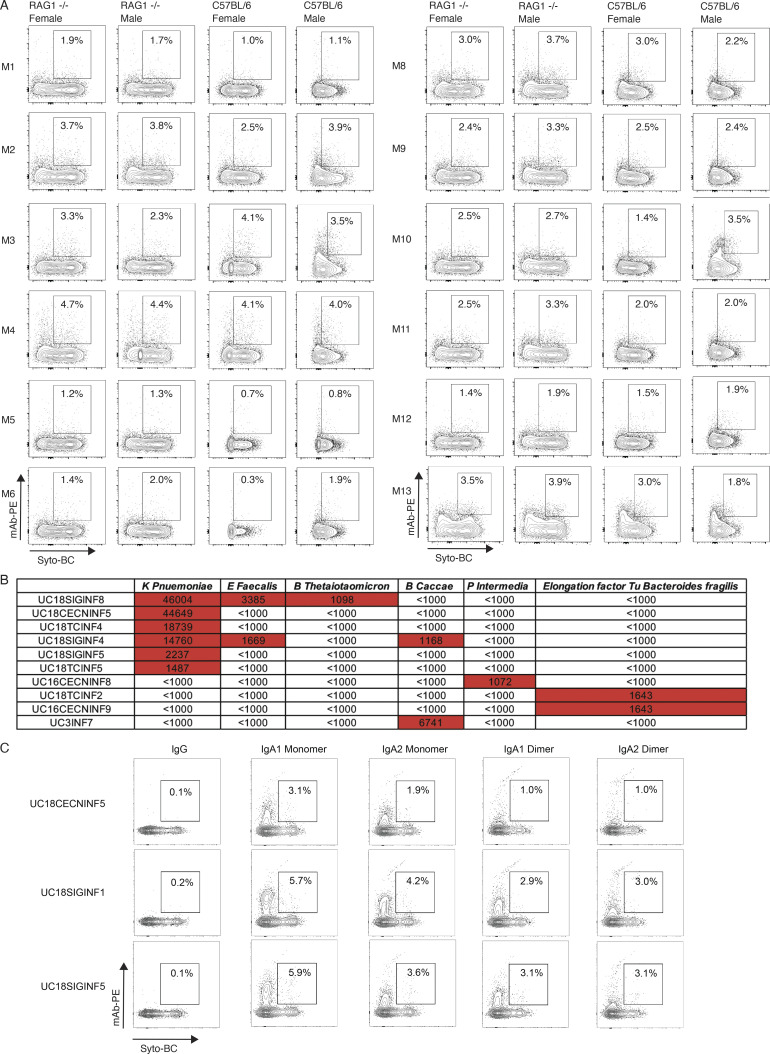
Figure S5.
Binding of mAbs and mAb mixes to stool from RAG1-deficient and C57BL/6 mice and bacterial proteins and extracts. (A) FACS plots display SYTO-BC (x axis) and mAb mix staining (y axis) of stool from female and male RAG1-deficient and C57BL/6 mice with the double-positive population indicated through gating. Antibody binding was detected through a mouse anti-human IgG antibody coupled to PE (Materials and methods). The composition of each antibody mix used is summarized in Table S5 and bacterial staining was conducted so that each mAb was present at a concentration of 10 μg/ml. FACs experiments were repeated twice. (B) Table summarizing the fluorescence intensity values as measured on a GenePix 4000B imager (Axion) for the mAbs that showed binding in a screen of all 152 mAbs for binding to 50 bacterial lysates and antigens (Table S7 and Materials and methods). Values above 1,000 are considered positive and highlighted in red. (C) FACS plots display SYTO-BC (x axis) and mAb staining (y axis) of stool from RAG1-deficient mice with the double-positive population indicated through gating. K. pneumoniae–binding mAbs UC18CECNINF5, UC18SIGINF1, and UC18SIGINF5 in IgG1, IgA1, and IgA2 forms were used for staining as indicated and their binding was detected with mouse anti-human IgG or mouse anti-human IgA antibody coupled to PE (Materials and methods). FACs experiments were repeated twice.

