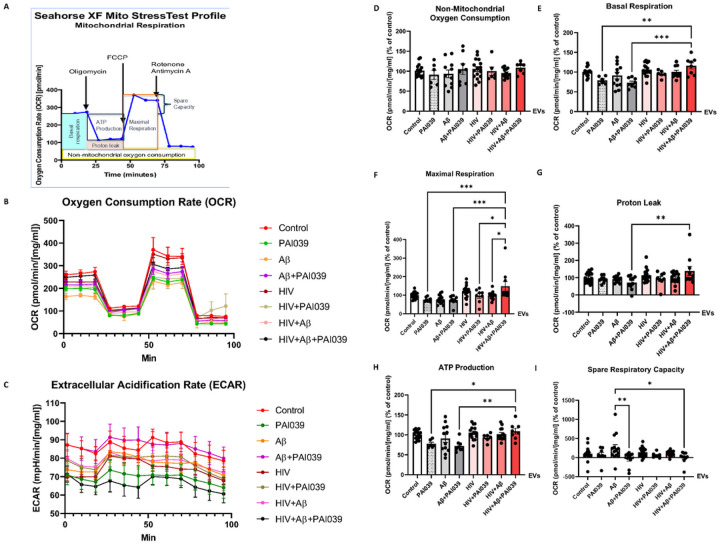
Figure 7. Mitochondrial functions in recipient NPCs after exposure to HBMEC-derived EVs.
Non-transfected HBMEC were treated as in Figure 3. EVs were isolated from the culture media and employed for NPC treatment for 24 h in the presence or absence of the Serpine-1 inhibitor PAI039 (2 μM). (A) Seahorse Mitochondrial Stress Test diagram. (B) Oxygen consumption rates (OCR) and (C) Extracellular acidification rates (ECAR) in the treatment groups. (D) Non-mitochondrial oxygen consumption, (E) Basal respiration, (F) Maximal respiration, (G) Proton leak, (H) ATP production, (I) Spare respiratory capacity in the treatment groups are represented as % of the control. Representative graphs from three experiments. Values are mean ± SEM, n=6–18. One-, two- and three-way ANOVA with Šídák’s and Tukey’s multiple comparisons tests. *Statistically significant at p<0.05, **p<0.01, ***p<0.001.

