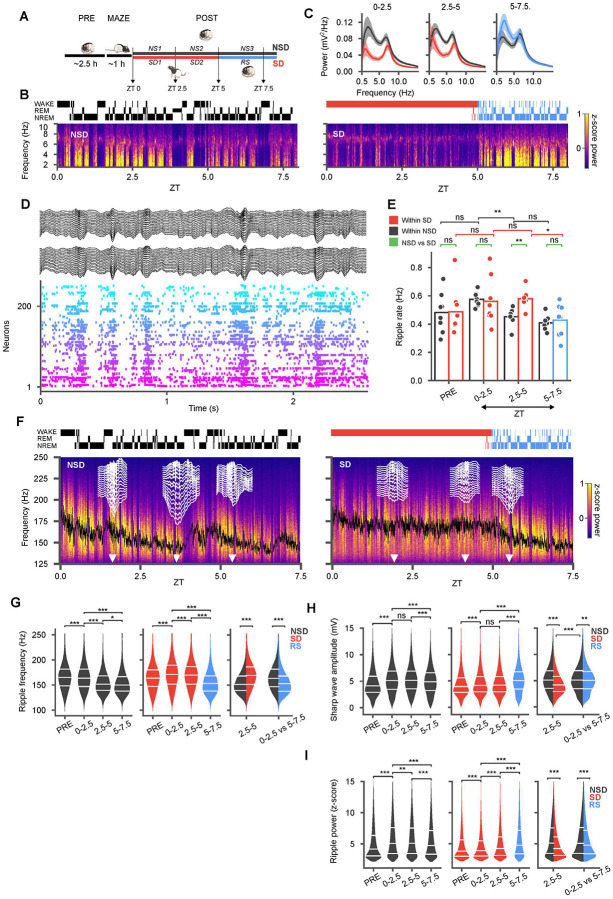
Figure 1: Sleep deprivation yields a similar amount of sharp-wave ripples but with lower amplitude sharp waves and higher frequency ripples compared to natural sleep.
(A) After 2.5 h of rest and sleep in the home cage (PRE), animals were introduced to a novel track (MAZE) then returned to the home cage for either undisturbed sleep (NS1 and NS2), or 5h sleep deprivation (SD1 and SD2), followed by recovery sleep (RS). (B) Power spectral density (top right) in sample NSD (left) and SD (right) sessions from one rat with hypnogram (top) and spectrogram (bottom) of bandpass filtered (1–10 Hz) local field potential from CA1. (C) Average power spectral densities across all SD/RS (red/blue with corresponding shaded confidence intervals) and NSD (black with shaded confidence intervals) sessions in different blocks demonstrate suppressed spectral power during SD and a rebound in slow oscillations in RS. (D) Sample recording during sleep with local field potentials from two recording shanks (black, 16 channels each) along with rasters from simultaneously recorded units (arbitrary color and sorting). (E) Rate of ripples in various blocks compared between different NSD (black), SD (red) sessions, and RS (blue). Individual sessions are superimposed as dots over the bar plots. The rate of ripples decreases with sleep but remains elevated during sleep loss. (F) Power spectral densities in the ripple frequency band for the same sessions as in (B) with moving average of ripple frequency superimposed (black). Sample sharp-wave ripples (white traces across a 16-channel shank) at different time points (white arrow heads). (G) Violin plots across NSD (black) and SD/RS (red/blue) blocks show higher frequency of ripples in SD compared to NSD, with an undershoot in RS. Split violins in rightmost panel highlight cross-group comparisons for the second block of NSD vs SD and the first block of sleep (NS1 vs RS) in both groups. (H, I) Same as (G) for sharp-wave amplitude (H) and ripple band power (I) z-scored relative to session means (NSD/SD: each 8 sessions from 7 animals). Sharp-wave amplitudes and ripple power were lower in SD but partially rebounded in RS. (*p < 0.05; ** p < 0.01; *** p < 0.001)

