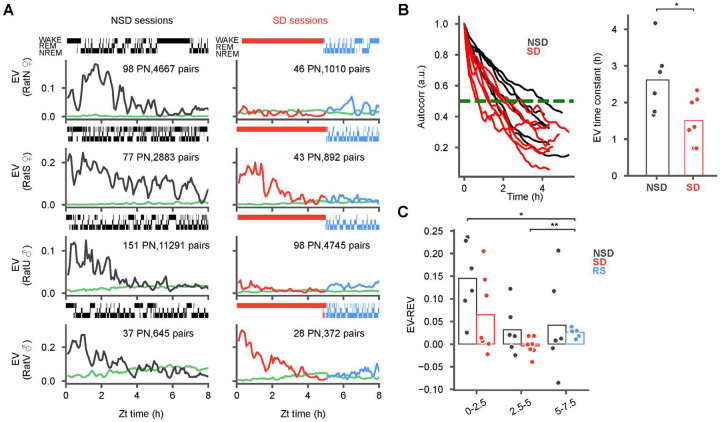
Figure 3: Reactivation attenuates during sleep deprivation and is not rescued by recovery sleep.
(A) Explained variance (EV) of pairwise reactivation (NSD, black; SD, red) and its reverse (REV, green) during POST in natural sleep (NSD; left column) and sleep deprivation (SD) with recovery sleep (RS; right column) sessions from 4 animals (sex indicated on the y-axis). Shaded regions indicate low standard deviations. Additional sessions are provided in Extended Data Figure 1. NSD sessions feature robust reactivation lasting for hours while SD sessions show either some (rats S and V) or almost reactivation (rats N and U). (B) The EV auto-correlation (left panel) and corresponding time constants (right panel) derived from the half maxima (NSD: 5 animals, 6 sessions; SD: 6 animals, 7 sessions) demonstrate significantly faster decay in SD vs NSD. (C) Difference of EV and REV were calculated at ZT 0–2.5, ZT 2.5–5 and ZT 5–7.5, with markers for individual sessions superimposed. Note the significant increase between SD2 and RS, but significantly lower RS compared to NS1. (Wilcoxon signed rank tests for within group comparisons (panel C), and Wilcoxon rank-sum tests for across group comparisons (panel B) *p < 0.05)

