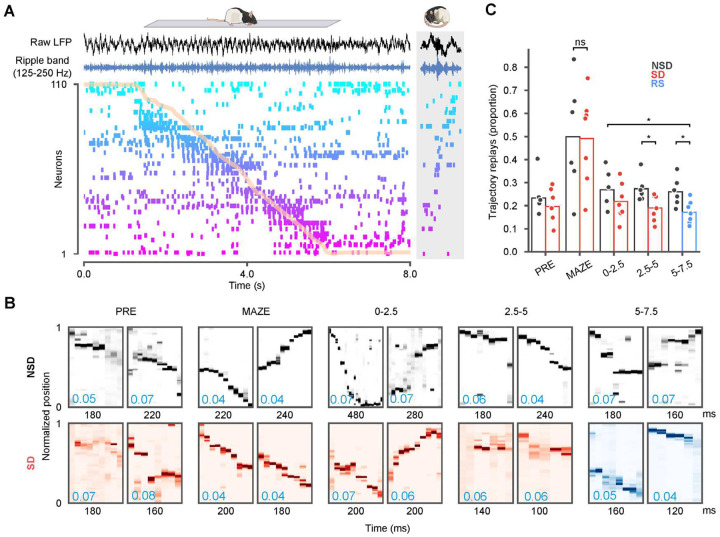
Figure 4: Trajectory replays deteriorate over sleep deprivation and recovery sleep.
(A) Hippocampal spike raster and local field (LFP) during a sample run on the track (normalized track position overlaid in orange). Each row provides spike times for a single neuron, ordered by place field location. Raw LFP (black) and ripple-band filtered traces (blue) from one electrode are shown above the raster. The gray box on the right provides a sample replay sequence from POST sleep. (B) Two example trajectory replays shown for each of the PRE, MAZE, 0–2.5, 2.5–5, and 5–7.5 epochs. In each epoch, the sample events shown had traversed distances in the top 10 percentile and mean jump distance (blue text, lower left) across sequentially decoded bins in the lowest 10 percentile. (C) The proportion of candidate ripple events in different sleep (NSD) or sleep deprivation (SD) and recovery sleep (RS) epochs that decoded continuous trajectories. SD sessions featured significantly fewer trajectory replays by the second block. The proportion of replays in recovery sleep was significantly lower than the equivalent period in natural sleep (Wilcoxon rank-sum tests, *p < 0.05)

