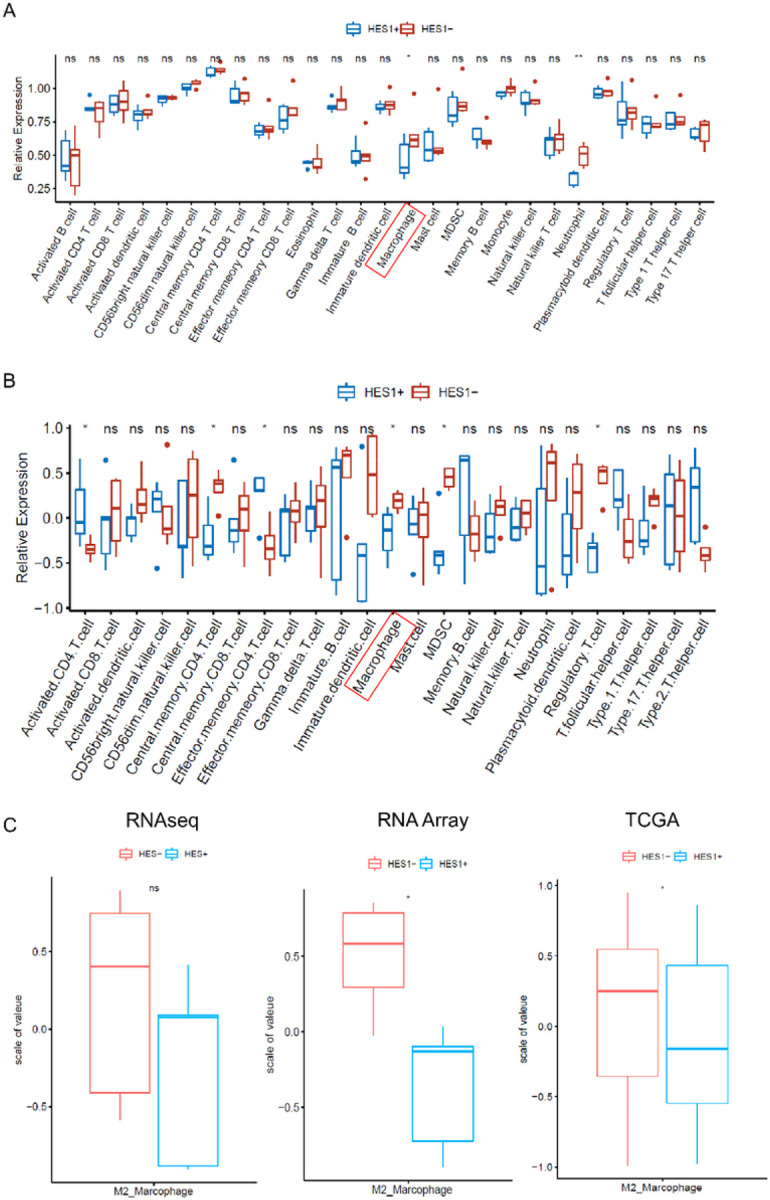
Figure 4. Correlation between HES1 expression and tumor infiltrating immune cell signatures.

(A-B) Tumor infiltrating immune cell signature was analyzed. The signature of macrophage was elevated in HES1 (−) group from both RNA sequencing (A) and Nanostring Array (B) (p<0.05). M2 macrophage were sub-clustered by the expression of CD206, CD204 and CD163. Higher M2 macrophages in HES1 (−) group were observed in RNA sequencing, Nanostring Array and TCGA data (* p<0.05) (C).
