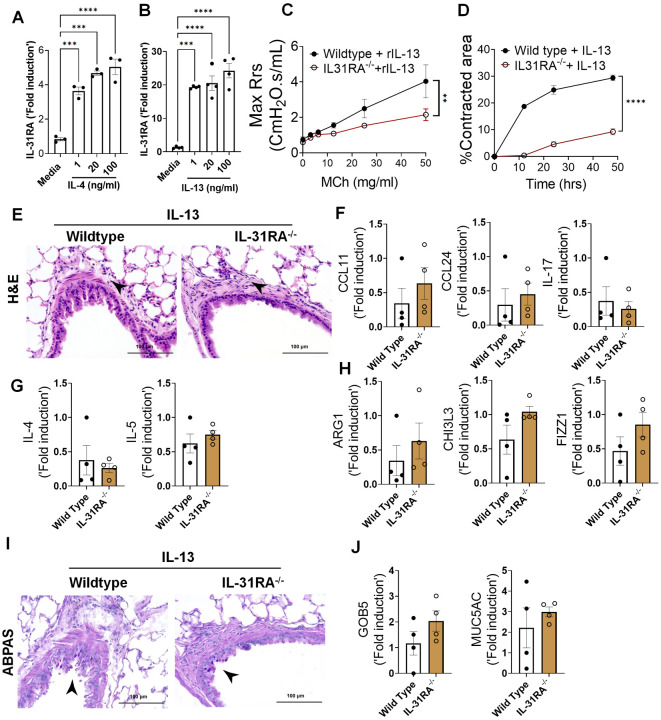
Figure 7. Th2 cytokines upregulate IL-31RA to induce AHR with no effect on inflammation and goblet cell hyperplasia.
(A and B) Quantification of IL-31RA transcripts in mouse airway smooth muscle cells (ASMC) treated with increasing doses of IL-4 and IL-13 for 16 h. One-way ANOVA test was used, n = 3/group; * p<0.05. (C) Wild-type and IL-31RA−/− mice were treated intratracheally with IL-13 on days D0 and D6 and resistance in the lungs was measured with increasing doses of methacholine (MCh) using FexiVent. Data are shown as mean ± SEM, n=4/group. Two-way ANOVA test was used, *p<0.05. (D) ASMC isolated from wild-type and IL-31RA−/− mice were seeded into collagen gels and treated with IL-13 to measure the contraction of collagen gels after 48 hours. Two-tailed Student’s t-test was used, n=3/group; * p<0.05. (E) Representative images of hematoxylin and eosin -stained lung sections from wild-type and IL-31RA−/− mice treated with IL-13. Images were captured at 20x magnification, scale bar 100 μm. (F, G and H) Quantification of inflammatory chemokines (CCL11, CCL24 and IL-17), Th2 cytokines (IL-4 and IL-5), and Th2 response-associated genes (ARG1, CHl3L3, and FIZZ1) in the whole lungs of wild-type and IL-31RA−/− mice treated with IL-13. Data are shown as mean ± SEM, n=4/group, Two-tailed Student’s t-test was used and no statistical significance observed between groups. (I) Representative images of alcian blue periodic acid shiff stained lung sections from wild-type and IL-31RA−/− mice treated with IL-13. Images were captured at 20x magnification, scale bar 100 μm. (J) Quantification of goblet cell hyperplasia associated genes including GOB5 and MUC5AC transcript levels in the total lungs of wild-type and IL-31RA−/− mice treated with IL-13. Data are shown as means ± SEM, n=4/group, Two-tailed Student’s t-test was used and no statistical significance observed between groups.

