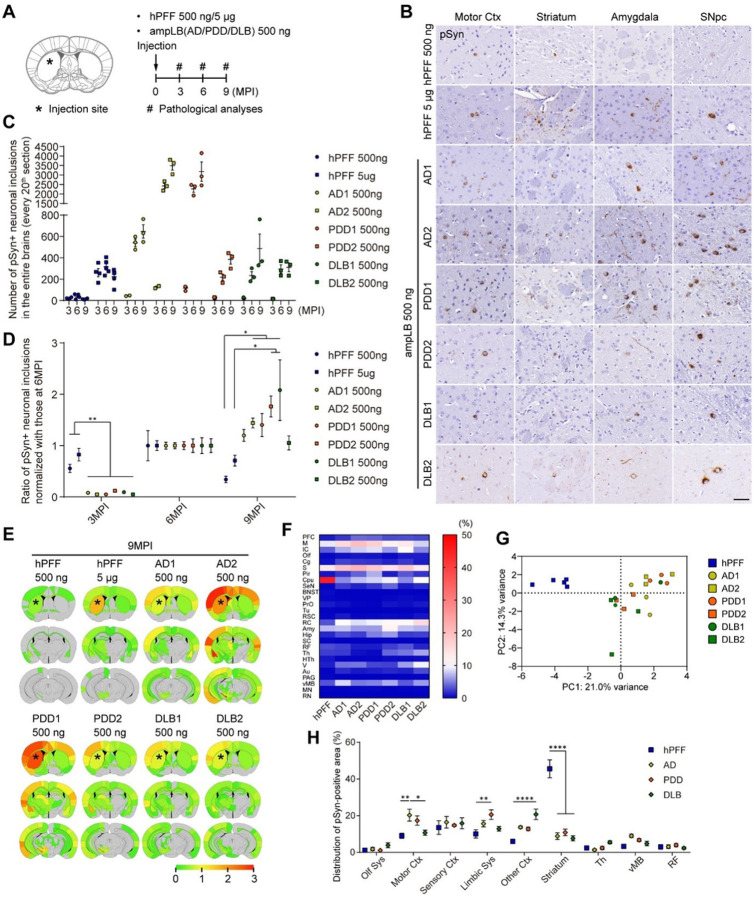
Figure 2. Differences in seeding activity and distribution of αSyn pathology between hPFF and ampLB in WT mice.
(A) Schematic representation of experimental design. (B) Immunohistochemistry with an anti-pSyn antibody (EP1536Y) at 6MPI. Motor Ctx, motor cortex; SNpc, substantia nigra pars compacta. Scale bar 50 μm. (C) Number of pSyn-positive neuronal somatic inclusions in the entire brains (n = 2–5 per group). (D) Ratio of numbers of pSyn-positive neuronal somatic inclusions normalized with those at 6MPI (n = 2–5 per group). One-way ANOVA with a Tukey’s post-hoc test was performed for 3MPI and 9MPI; *p < 0.05 and **p < 0.01. (E) Heat map colors represent the extent of pSyn-positive pathology at 9MPI. (F) Heat map colors represent proportion of pSyn-positive area in each brain region shown in Figure S5B at 9MPI. (G) Primary component analysis of the distribution of pSyn-positive pathology at 9MPI. (H) Distribution of pSyn-positive pathology in the brain systems at 9MPI (n = 5–6 per group). Olf Sys, olfactory system; Motor Ctx, motor cortex; Sensory Ctx, sensory cortex; Limbic Sys, limbic system; Th, thalamus; vMB, ventral midbrain; RF, reticular formation. Two-way ANOVA with a Sidak’s post-hoc test was performed; interaction (p < 0.0001), *p < 0.05, **p < 0.01, and ****p < 0.0001. Data are represented as mean ± SEM.

