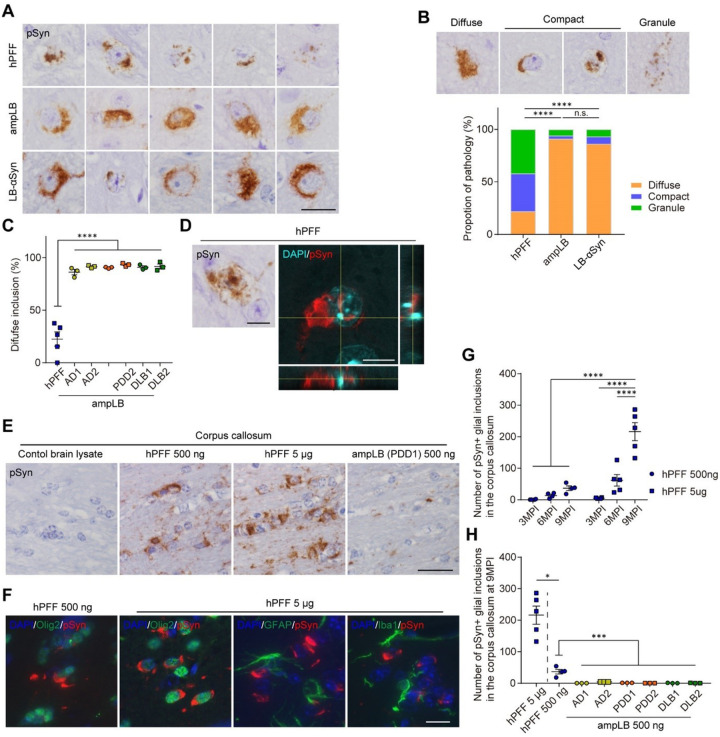
Figure 3. Differences in morphology of neuronal inclusions and cell-type preference between hPFF and ampLB in WT mice.
(A) High-magnification images of pSyn-positive neuronal inclusions in the SN of hPFF-, ampLB-, and LB-αSyn-injected mice at 6MPI. Scale bar 20 μm. (B) Upper panels: Representative images of diffuse, compact, and granular pSyn-positive inclusions. Lower panels: Comparison of the proportions of diffuse, compact, and granular inclusions (hPFF, n = 50; ampLB, n = 959; LB-αSyn, n = 29). A Fisher’s exact test was performed between two groups for differences in the percentages of diffuse and non-diffuse inclusions; ****p< 0.0001, n.s., not significant. (C) Percent of diffuse inclusions in hPFF- and ampLB-injected mice (n = 3–5 per group). One-way ANOVA with a Tukey’s post-hoc test was performed; ****p < 0.0001. (D) Immunohistochemistry and z-stack confocal microscopy images showing pSyn-positive intranuclear inclusions in hPFF-injected mice. Scale bars 10 μm. (E) Immunohistochemistry with a pSyn antibody (EP1536Y) in the corpus callosum at 9MPI. (F) Double immunofluorescence for Olig2 (green) and pSyn (81A, red), GFAP (green) and pSyn (EP1536Y, red), and Iba1 (green) and pSyn (81A, red). (G) Number of pSyn-positive oligodendroglial inclusions in the corpus callosum (n = 4–5 per group). Two-way ANOVA with a Sidak’s post-hoc test was performed; interaction (p = 0.0001), ****p < 0.0001. (H) Number of pSyn-positive oligodendroglial inclusions in the corpus callosum at 9MPI (n = 3–5 per group). A Mann Whitney test was performed between hPFF 5 μg and hPFF 500 ng; *p < 0.05. One-way ANOVA with a Tukey’s post-hoc test was performed among hPFF 500 ng and ampLB preparations; ***p < 0.001. Data are represented as mean ± SEM.

