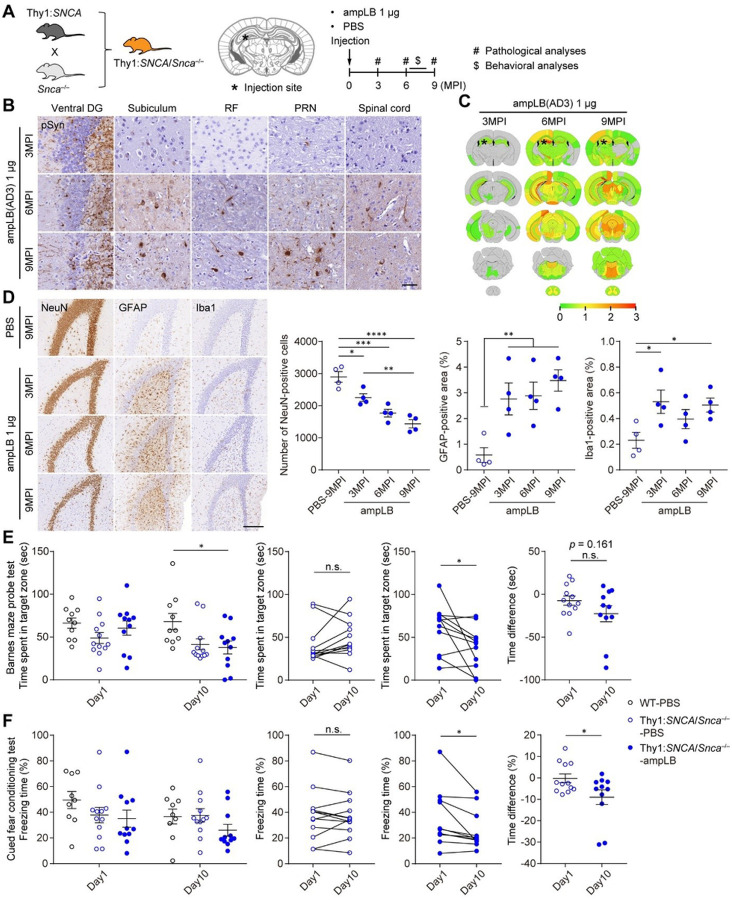
Figure 4. Modeling LBD in Thy1:SNCA/Stoca−/− mice.
(A) Schematic representation of experimental design. (B) Immunohistochemistry with an anti-pSyn antibody (EP1536Y) on the ipsilateral side. Ventral DG, ventral dentate gyrus; RF, reticular formation; PRN, pontine reticular formation. Scale bar 50 μm. (C) Heat map colors represent extent of pSyn-positive pathology. (D) Left panels: Immunohistochemistry with anti-NeuN, GFAP and Iba1 antibodies in the ipsilateral ventral dentate gyrus. Scale bar 200 μm. Right panels: Number of NeuN-positive cells, GFAP-positive area, and Iba1-positive area in the ipsilateral ventral dentate gyrus (n = 4 per group). One-way ANOVA with a Tukey’s post-hoc test was performed for number of NeuN-positive cells and GFAP-positive area. One-way ANOVA with a Dunnett’s post-hoc test was performed for Iba1-positive area; *p < 0.05, **p < 0.01, ***p < 0.001, and ****p < 0.0001. (E) Barnes maze probe test at 7MPI (n = 10–12 per group). Left panel: Time spent in a target zone at day1 and day10. One-way ANOVA with a Tukey’s post-hoc test was performed for day10; *p < 0.05. Middle panels: Time spent in a target zone between day1 and day10. A two-tailed paired test was performed; *p < 0.05, n.s., not significant. Right panel: Difference in time spent in a target zone between day1 and day10. A two-tailed unpaired Student’s t-test was performed; n.s., not significant. (F) Cued fear conditioning test at 8MPI (n = 9–12 per group). Left panel: Freezing time during auditory cue at day1 and day10. Middle panels: freezing time between day1 and day10. A two-tailed paired test was performed; *p < 0.05, n.s., not significant. Right panel: Difference in freezing time between day1 and day10. A two-tailed unpaired Student’s t-test was performed; *p < 0.05. Data are represented as mean ± SEM.

