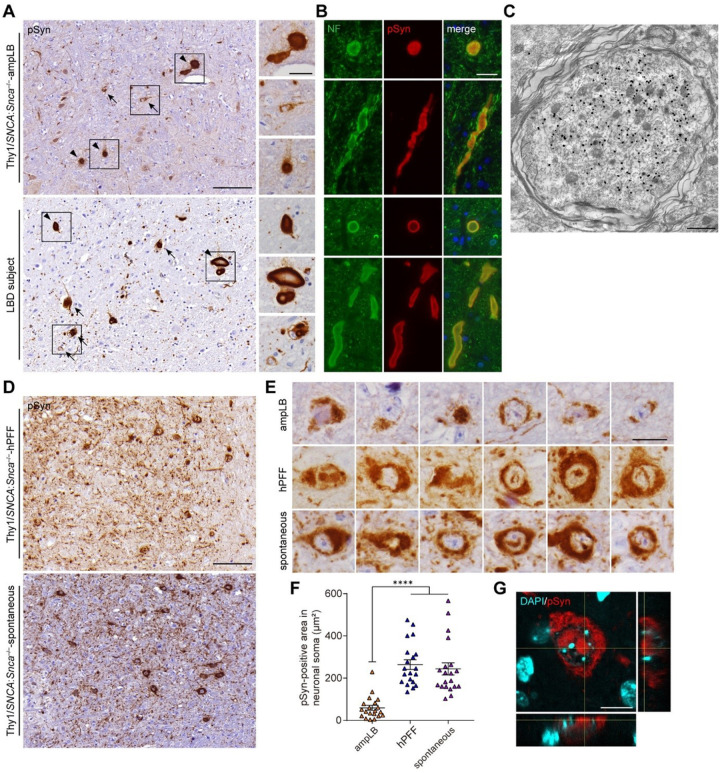
Figure 6. Similarities and differences in pathological characteristics among Thy1:SNCA/Snca−/− mouse models and LBD subjects.
(A) Immunohistochemistry with an anti-pSyn antibody (EP1536Y) in the pons of an ampLB-injected Thy1:SNCA/Snca−/− mouse (Thy1:SNCA/Snca−/−-ampLB) at 9MPI and a LBD subject. Arrows and arrowheads indicate pSyn-positive neuronal inclusions and axonal swelling-like structures, respectively. Scale bars 100 μm, 20 μm (inset). (B) Double immunofluorescence for neurofilament (NF, green) and pSyn (#64, red). Upper panels: an ampLB-injected Thy1:SNCA/Snca−/− mouse, Lower panels: a LBD subject. Scale bar 20 μm. (C) Immunoelectron micrograph of an axonal swelling in the pons of an ampLB-injected Thy1:SNCA/Snca−/− mouse with immunogold-labeled pSyn (EP1536Y). Scale bar 1 μm. (D) Immunohistochemistry with an anti-pSyn antibody EP1536Y in the pons of a hPFF-injected Thy1:SNCA/Snca−/− mouse (Thy1:SNCA/Snca−/−-hPFF) at 6MPI and a Thy1:SNCA/Snca−/− mouse with spontaneous αSyn pathology (Thy1:SNCA/Snca−/−-spontaneous) at 13 months of age. (E) High-magnification images of pSyn-positive neuronal inclusions in the pons of ampLB-injected Thy1:SNCA/Snca−/− mice at 6MPI, hPFF-injected Thy1:SNCA/Snca−/− mice at 6MPI, and Thy1:SNCA/Snca−/− mice with spontaneous αSyn pathology. Scale bar 20 μm. (F) PSyn-positive area in neuronal soma (n = 20 per group). One-way ANOVA with a Tukey’s post-hoc test was performed; ****p < 0.0001. (G) Z-stack confocal microscopy images showing pSyn-positive intranuclear inclusions in hPFF-injected mice. Scale bar 10 μm. Data are represented as mean ± SEM.

