
Extended Data Fig. 4. Selinexor-induced AKT activation requires the P2RY2 purinergic receptor.
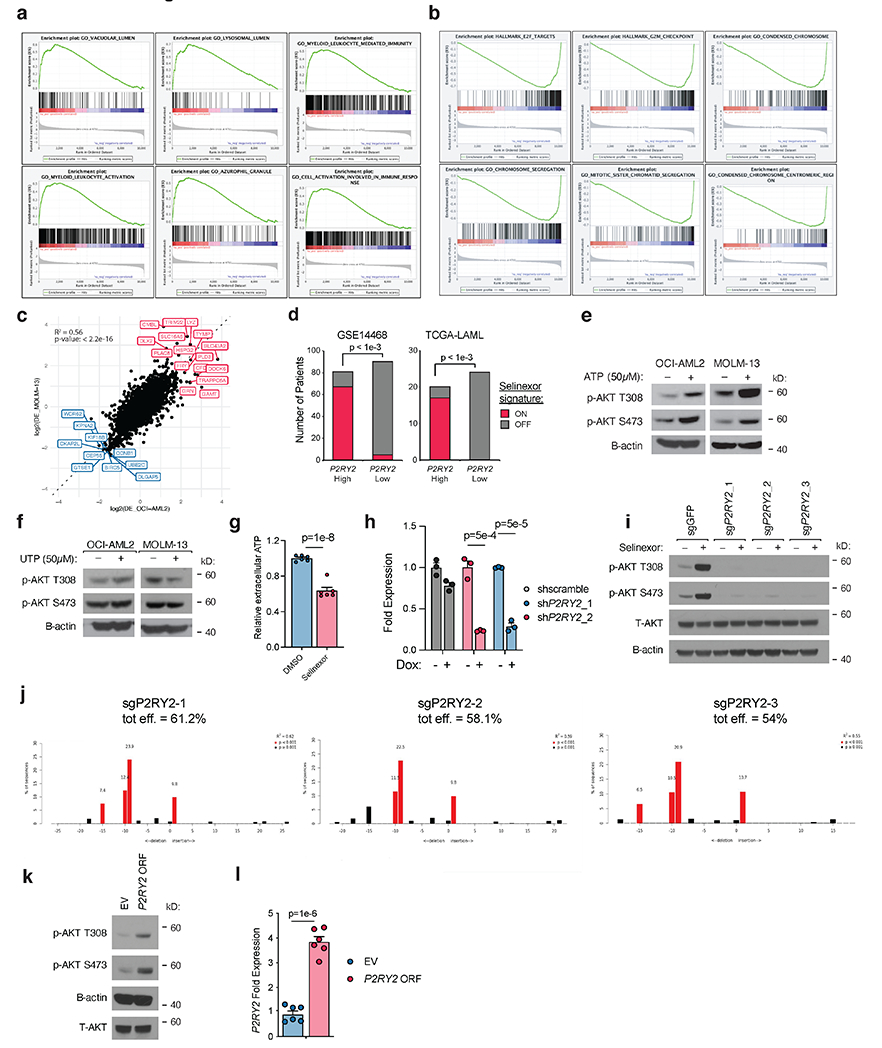
a) GSEA plots for gene ontologies enriched in RNA-seq datasets upon selinexor treatment.
b) GSEA plots for gene ontologies depleted in RNA-seq datasets upon selinexor treatment.
c) Comparison of differential gene expression analysis in OCI-AML2 and MOLM-13 cells treated +/− selinexor. The genes in red are upregulated in both cell lines when treated with selinexor whereas the genes in blue are downregulated in both cell lines.
d) Selinexor gene signature representation in AML patients with low versus high P2RY2 expression. ON versus OFF selinexor signatures were assigned for each patient based on the ES z-score > 1 or < −1, respectively. The number of selinexor-ON patients in the P2RY2 high subset versus the P2RY2 low subset was compared; P-values computed using two-sided Fisher’s t-test.
e) Immunoblot depicting protein levels of phosphorylated AKT at T308 and S473 in OCI-AML2 and MOLM-13 cells treated with 50μM ATP for 48 hours.
f) As in (e) but cells were treated with UTP.
g) Relative extracellular ATP concentration in OCI-AML2 cells treated with selinexor versus DMSO control for 36 hours. P-values computed using Welch’s unpaired (two-sided) t-tests; data are presented as mean +/− s.e.m. for n = 6 biological replicates.
h) Relative expression of P2RY2 in OCI-AML2 cells stably expressing indicated TetOn shRNA constructs following 48 hours of doxycycline treatment.
i) Immunoblot depicting protein levels of total and phosphorylated AKT at T308 and S473 in OCI-AML2 cells expressing Cas9 and sgRNAs targeting GFP control or P2RY2 treated with selinexor or DMSO. B-actin included as loading control.
j) Tide analysis of OCI-AML2 cells expressing sgP2RY2 to access knockout efficiency. .
k) Immunoblot depicting protein levels of total and phosphorylated AKT at T308 and S473 in OCI-AML2 cells overexpressing P2RY2 or empty vector in OCI-AML2 cells. B-actin included as loading control.
l) Relative expression of P2RY2 in OCI-AML2 cells stably expressing either empty vector or P2RY2 ORF.
Extended Data Figure 4h, l P-values computed using multiple unpaired (two-sided) t-tests; data presented as mean +/−s.e.m. for n = 3 biological replicates.
Extended Data Figure 4e,f,i,k Representative immunoblots of n=2-3 biologically independent experiments yielding similar results. B-actin included as loading control.